Wells Fargo 2012 Annual Report Download - page 73
Download and view the complete annual report
Please find page 73 of the 2012 Wells Fargo annual report below. You can navigate through the pages in the report by either clicking on the pages listed below, or by using the keyword search tool below to find specific information within the annual report.-
 1
1 -
2
-
3
-
4
-
5
-
6
-
7
-
8
-
9
-
10
-
11
-
12
-
13
-
14
-
15
-
16
-
17
-
18
-
19
-
20
-
21
-
22
-
23
-
24
-
25
-
26
-
27
-
28
-
29
-
30
-
31
-
32
-
33
-
34
-
35
-
36
-
37
-
38
-
39
-
40
-
41
-
42
-
43
-
44
-
45
-
46
-
47
-
48
-
49
-
50
-
51
-
52
-
53
-
54
-
55
-
56
-
57
-
58
-
59
-
60
-
61
-
62
-
 63
63 -
 64
64 -
 65
65 -
 66
66 -
 67
67 -
 68
68 -
 69
69 -
 70
70 -
 71
71 -
 72
72 -
 73
73 -
 74
74 -
 75
75 -
 76
76 -
 77
77 -
 78
78 -
 79
79 -
 80
80 -
 81
81 -
 82
82 -
 83
83 -
84
-
85
-
86
-
87
-
88
-
89
-
90
-
91
-
92
-
93
-
94
-
95
-
96
-
97
-
98
-
99
-
100
-
101
-
102
-
103
-
104
-
105
-
106
-
107
-
108
-
109
-
110
-
111
-
112
-
113
-
114
-
115
-
116
-
117
-
118
-
119
-
120
-
121
-
122
-
123
-
124
-
125
-
126
-
127
-
128
-
129
-
130
-
131
-
132
-
133
-
134
-
135
-
136
-
137
-
138
-
139
-
140
-
141
-
142
-
143
-
144
-
145
-
146
-
147
-
148
-
149
-
150
-
151
-
152
-
153
-
154
-
155
-
156
-
157
-
158
-
159
-
160
-
161
-
162
-
163
-
164
-
165
-
166
-
167
-
168
-
169
-
170
-
171
-
172
-
173
-
174
-
175
-
176
-
177
-
178
-
179
-
180
-
181
-
182
-
183
-
184
-
185
-
186
-
187
-
188
-
189
-
190
-
191
-
192
-
193
-
194
-
195
-
196
-
197
-
198
-
199
-
200
-
201
-
202
-
203
-
204
-
205
-
206
-
207
-
208
-
209
-
210
-
211
-
212
-
213
-
214
-
215
-
216
-
217
-
218
-
219
-
220
-
221
-
222
-
223
-
224
-
225
-
226
-
227
-
228
-
229
-
230
-
231
-
232
-
233
-
234
-
235
-
236
-
237
-
238
-
239
-
240
-
241
-
242
-
243
-
244
-
245
-
246
-
247
-
248
-
249
-
250
-
251
-
252
 |
 |
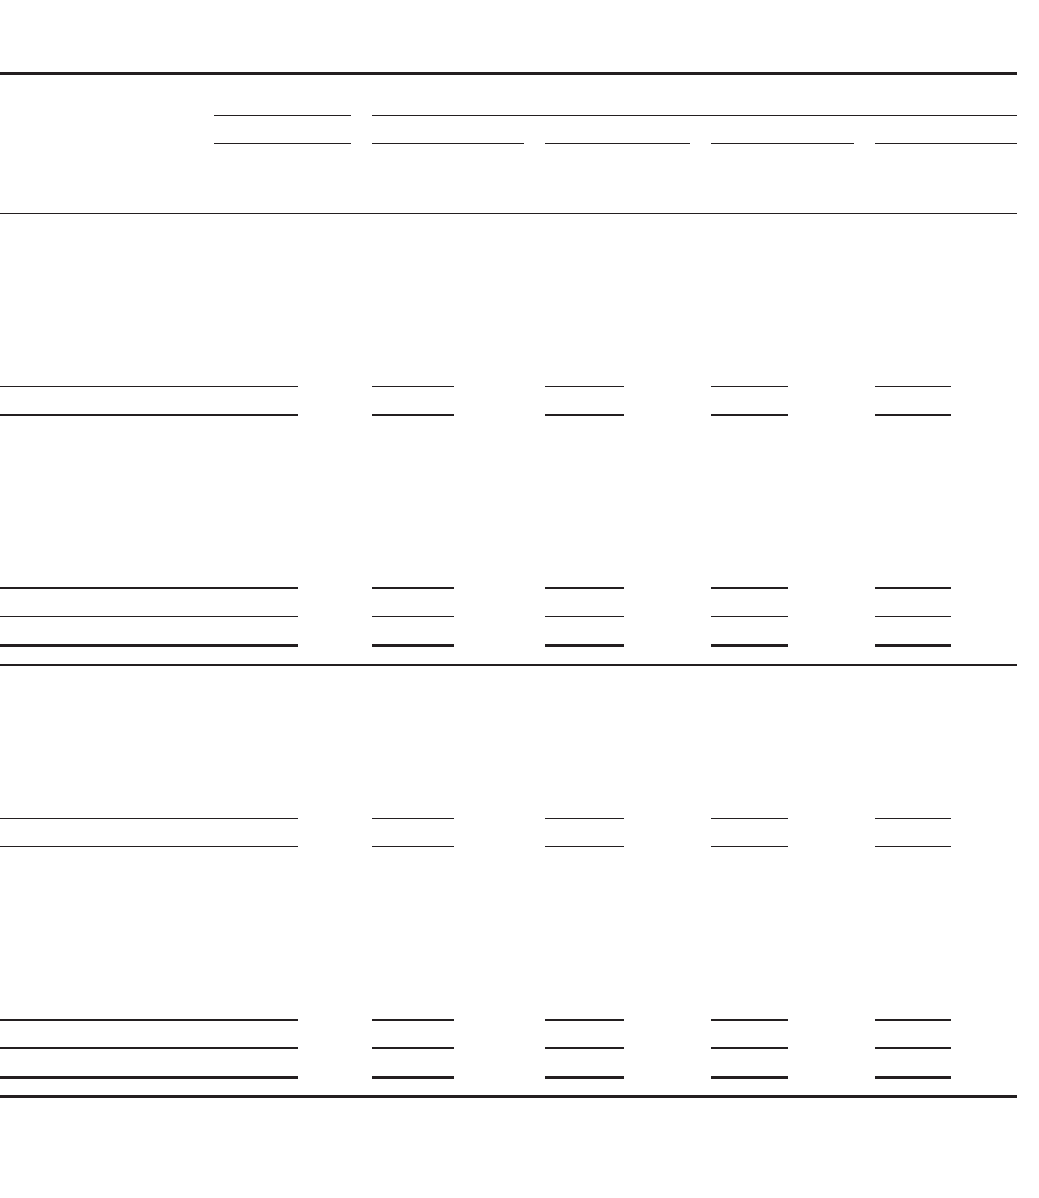
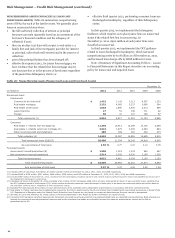
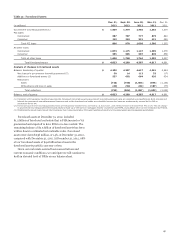
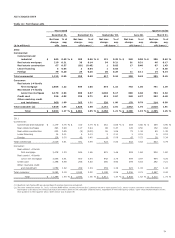
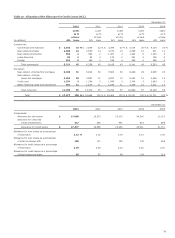
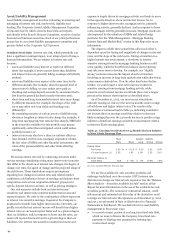
NET CHARGE-OFFS
Table 36: Net Charge-offs
Year ended Quarter ended
December 31, December 31, September 30, June 30, March 31,
Net loan % o
f
Net loan % of Net loan % o
f
Net loan % o
f
Net loan % o
f
charge- avg. charge- avg. charge- avg. charge- avg. charge- avg.
($ in millions) offs loans offs loans (1) offs loans (1) offs loans (1) offs loans (1)
2012
Commercial:
Commercial and
industrial $ 845 0.49 % $ 209 0.46 % $ 131 0.29 % $ 249 0.58 % $ 256 0.62 %
Real estate mortgage 219 0.21 38 0.14 54 0.21 81 0.31 46 0.17
Real estate construction 67 0.37 (18) (0.43) 1 0.03 17 0.40 67 1.43
Lease financing 5 0.04 2 0.04 1 0.03 - - 2 0.06
Foreign 79 0.20 24 0.25 30 0.29 11 0.11 14 0.14
Total commercial 1,215 0.35 255 0.29 217 0.24 358 0.42 385 0.45
Consumer:
Real estate 1-4 family
first mortgage 2,856 1.22 649 1.05 673 1.15 743 1.30 791 1.39
Real estate 1-4 family
junior lien mortgage 3,178 3.93 690 3.57 1,036 5.17 689 3.38 763 3.62
Credit card 916 4.02 222 3.71 212 3.67 240 4.37 242 4.40
Other revolving credit
and installment 869 1.00 265 1.21 220 1.00 170 0.79 214 0.99
Total consumer (2) 7,819 1.84 1,826 1.68 2,141 2.01 1,842 1.76 2,010 1.91
Total $ 9,034 1.17 % $ 2,081 1.05 % $ 2,358 1.21 % $ 2,200 1.15 % $ 2,395 1.25 %
2011
Commercial:
Commercial and industrial $ 1,179 0.75 % $ 310 0.74 % $ 261 0.65 % $ 254 0.66 % $ 354 0.96 %
Real estate mortgage 493 0.48 117 0.44 96 0.37 128 0.50 152 0.62
Real estate construction 205 0.95 (5) (0.09) 55 1.06 72 1.32 83 1.38
Lease financing 14 0.11 4 0.13 3 0.11 1 0.01 6 0.18
Foreign 128 0.35 45 0.45 8 0.08 47 0.52 28 0.34
Total commercial 2,019 0.61 471 0.54 423 0.50 502 0.62 623 0.79
Consumer:
Real estate 1-4 family
first mortgage 3,478 1.53 844 1.46 821 1.46 909 1.62 904 1.60
Real estate 1-4 family
junior lien mortgage 3,545 3.91 800 3.64 842 3.75 909 3.97 994 4.25
Credit card 1,198 5.58 256 4.63 266 4.90 294 5.63 382 7.21
Other revolving credit
and installment 1,059 1.22 269 1.24 259 1.19 224 1.03 307 1.42
Total consumer 9,280 2.18 2,169 2.02 2,188 2.06 2,336 2.21 2,587 2.42
Total $ 11,299 1.49 % $ 2,640 1.36 % $ 2,611 1.37 % $ 2,838 1.52 % $ 3,210 1.73 %
(1) Quarterly net charge-offs as a percentage of average loans are annualized.
(2) The year ended December 31, 2012, includes $888 million resulting from the OCC guidance issued in third quarter 2012, which requires consumer loans discharged in
bankruptcy to be placed on nonaccrual status and written down to net realizable collateral value, regardless of their delinquency status. Upon initial implementation of the
OCC guidance in third quarter 2012, $567 million was charged off.
71