Wells Fargo 2012 Annual Report Download - page 205
Download and view the complete annual report
Please find page 205 of the 2012 Wells Fargo annual report below. You can navigate through the pages in the report by either clicking on the pages listed below, or by using the keyword search tool below to find specific information within the annual report.-
 1
1 -
2
-
3
-
4
-
5
-
6
-
7
-
8
-
9
-
10
-
11
-
12
-
13
-
14
-
15
-
16
-
17
-
18
-
19
-
20
-
21
-
22
-
23
-
24
-
25
-
26
-
27
-
28
-
29
-
30
-
31
-
32
-
33
-
34
-
35
-
36
-
37
-
38
-
39
-
40
-
41
-
42
-
43
-
44
-
45
-
46
-
47
-
48
-
49
-
50
-
51
-
52
-
53
-
54
-
55
-
56
-
57
-
58
-
59
-
60
-
61
-
62
-
63
-
64
-
65
-
66
-
67
-
68
-
69
-
70
-
71
-
72
-
73
-
74
-
75
-
76
-
77
-
78
-
79
-
80
-
81
-
82
-
83
-
84
-
85
-
86
-
87
-
88
-
89
-
90
-
91
-
92
-
93
-
94
-
95
-
96
-
97
-
98
-
99
-
100
-
101
-
102
-
103
-
104
-
105
-
106
-
107
-
108
-
109
-
110
-
111
-
112
-
113
-
114
-
115
-
116
-
117
-
118
-
119
-
120
-
121
-
122
-
123
-
124
-
125
-
126
-
127
-
128
-
129
-
130
-
131
-
132
-
133
-
134
-
135
-
136
-
137
-
138
-
139
-
140
-
141
-
142
-
143
-
144
-
145
-
146
-
147
-
148
-
149
-
150
-
151
-
152
-
153
-
154
-
155
-
156
-
157
-
158
-
159
-
160
-
161
-
162
-
163
-
164
-
165
-
166
-
167
-
168
-
169
-
170
-
171
-
172
-
173
-
174
-
175
-
176
-
177
-
178
-
179
-
180
-
181
-
182
-
183
-
184
-
185
-
186
-
187
-
188
-
189
-
190
-
191
-
192
-
193
-
194
-
 195
195 -
 196
196 -
 197
197 -
 198
198 -
 199
199 -
 200
200 -
 201
201 -
 202
202 -
 203
203 -
 204
204 -
 205
205 -
 206
206 -
 207
207 -
 208
208 -
 209
209 -
 210
210 -
 211
211 -
 212
212 -
 213
213 -
 214
214 -
 215
215 -
216
-
217
-
218
-
219
-
220
-
221
-
222
-
223
-
224
-
225
-
226
-
227
-
228
-
229
-
230
-
231
-
232
-
233
-
234
-
235
-
236
-
237
-
238
-
239
-
240
-
241
-
242
-
243
-
244
-
245
-
246
-
247
-
248
-
249
-
250
-
251
-
252
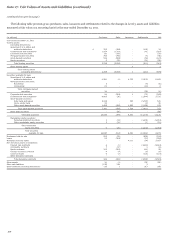
 |
 |

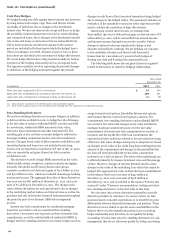
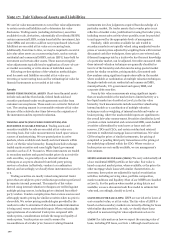
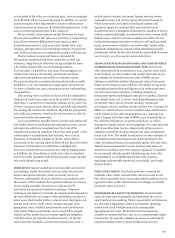
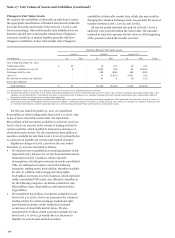
management and reports on top risks to the Company’s Board of
Directors, monitors all company-wide risks, including credit
risk, market risk, and reputational risk.
VENDOR-DEVELOPED VALUATIONS In certain limited
circumstances we obtain pricing from third party vendors for the
value of our Level 3 assets or liabilities. We have processes in
place to approve such vendors to ensure information obtained
and valuation techniques used are appropriate. Once these
vendors are approved to provide pricing information, we
monitor and review the results to ensure the fair values are
reasonable and in line with market experience in similar asset
classes. While the input amounts used by the pricing vendor in
determining fair value are not provided, and therefore
unavailable for our review, we do perform one or more of the
following procedures to validate the prices received:
comparison to other pricing vendors (if available);
variance analysis of prices;
corroboration of pricing by reference to other independent
market data such as market transactions and relevant
benchmark indices;
review of pricing by Company personnel familiar with
market liquidity and other market-related conditions; and
investigation of prices on a specific instrument-by-
instrument basis.
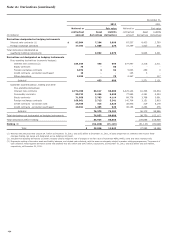
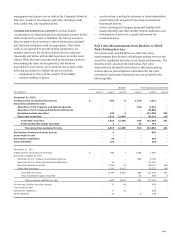
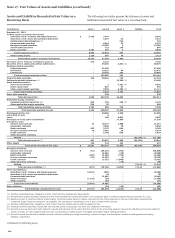
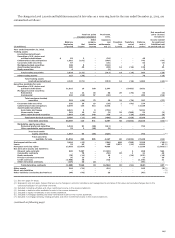
Fair Value Measurements from Brokers or Third
Party Pricing Services
For certain assets and liabilities, we obtain fair value
measurements from brokers or third party pricing services and
record the unadjusted fair value in our financial statements. The
detail by level is shown in the table below. Fair value
measurements obtained from brokers or third party pricing
services that we have adjusted to determine the fair value
recorded in our financial statements are not included in the
following table.
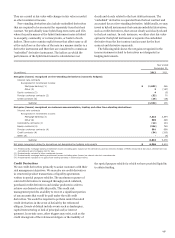
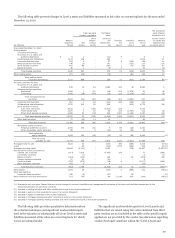
Brokers Third party pricing services
(in millions) Level 1 Level 2 Level 3 Level 1 Level 2 Level 3
December 31, 2012
Trading assets (excluding derivatives) $ - 406 8 1,314 1,016 -
Securities available for sale:
Securities of U.S. Treasury and federal agencies - - - 915 6,231 -
Securities of U.S. states and political subdivisions - - - - 35,036 -
Mortgage-backed securities - 138 4 - 121,703 292
Other debt securities - 1,516 12,465 - 28,314 149
Total debt securities - 1,654 12,469 915 191,284 441
Total marketable equity securities - 3 - 29 774 -
Total securities available for sale - 1,657 12,469 944 192,058 441
Derivatives (trading and other assets) - 8 - - 602 -
Loans held for sale - - - - - -
Derivatives (liabilities) - 26 - - 634 -
Other liabilities - 121 - - 104 -
December 31, 2011
Trading assets (excluding derivatives) $ - 446 7 1,086 1,564 -
Securities available for sale:
Securities of U.S. Treasury and federal agencies - - - 868 5,748 -
Securities of U.S. states and political subdivisions - 16 - - 21,014 -
Mortgage-backed securities - 2,342 43 - 118,107 186
Other debt securities - 1,091 8,163 - 26,222 145
Total debt securities - 3,449 8,206 868 171,091 331
Total marketable equity securities - - - 33 665 3
Total securities available for sale - 3,449 8,206 901 171,756 334
Derivatives (trading and other assets) - 17 44 - 834 -
Loans held for sale - - - - 1 -
Derivatives (liabilities) - 11 43 - 850 -
Other liabilities - 22 - 6 249 -
203