Wells Fargo 2012 Annual Report Download - page 36
Download and view the complete annual report
Please find page 36 of the 2012 Wells Fargo annual report below. You can navigate through the pages in the report by either clicking on the pages listed below, or by using the keyword search tool below to find specific information within the annual report.-
 1
1 -
2
-
3
-
4
-
5
-
6
-
7
-
8
-
9
-
10
-
11
-
12
-
13
-
14
-
15
-
16
-
17
-
18
-
19
-
20
-
21
-
22
-
23
-
24
-
25
-
 26
26 -
 27
27 -
 28
28 -
 29
29 -
 30
30 -
 31
31 -
 32
32 -
 33
33 -
 34
34 -
 35
35 -
 36
36 -
 37
37 -
 38
38 -
 39
39 -
 40
40 -
 41
41 -
 42
42 -
 43
43 -
 44
44 -
 45
45 -
 46
46 -
47
-
48
-
49
-
50
-
51
-
52
-
53
-
54
-
55
-
56
-
57
-
58
-
59
-
60
-
61
-
62
-
63
-
64
-
65
-
66
-
67
-
68
-
69
-
70
-
71
-
72
-
73
-
74
-
75
-
76
-
77
-
78
-
79
-
80
-
81
-
82
-
83
-
84
-
85
-
86
-
87
-
88
-
89
-
90
-
91
-
92
-
93
-
94
-
95
-
96
-
97
-
98
-
99
-
100
-
101
-
102
-
103
-
104
-
105
-
106
-
107
-
108
-
109
-
110
-
111
-
112
-
113
-
114
-
115
-
116
-
117
-
118
-
119
-
120
-
121
-
122
-
123
-
124
-
125
-
126
-
127
-
128
-
129
-
130
-
131
-
132
-
133
-
134
-
135
-
136
-
137
-
138
-
139
-
140
-
141
-
142
-
143
-
144
-
145
-
146
-
147
-
148
-
149
-
150
-
151
-
152
-
153
-
154
-
155
-
156
-
157
-
158
-
159
-
160
-
161
-
162
-
163
-
164
-
165
-
166
-
167
-
168
-
169
-
170
-
171
-
172
-
173
-
174
-
175
-
176
-
177
-
178
-
179
-
180
-
181
-
182
-
183
-
184
-
185
-
186
-
187
-
188
-
189
-
190
-
191
-
192
-
193
-
194
-
195
-
196
-
197
-
198
-
199
-
200
-
201
-
202
-
203
-
204
-
205
-
206
-
207
-
208
-
209
-
210
-
211
-
212
-
213
-
214
-
215
-
216
-
217
-
218
-
219
-
220
-
221
-
222
-
223
-
224
-
225
-
226
-
227
-
228
-
229
-
230
-
231
-
232
-
233
-
234
-
235
-
236
-
237
-
238
-
239
-
240
-
241
-
242
-
243
-
244
-
245
-
246
-
247
-
248
-
249
-
250
-
251
-
252
 |
 |

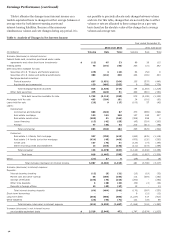
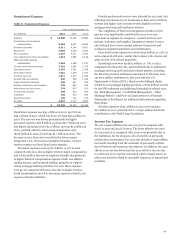
Earnings Performance
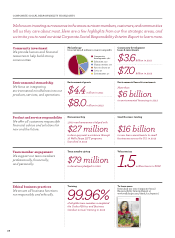
Wells Fargo net income for 2012 was $18.9 billion ($3.36 diluted
earnings per common share), compared with $15.9 billion
($2.82 diluted per share) for 2011 and $12.4 billion ($2.21
diluted per share) for 2010. Our 2012 earnings reflected strong
execution of our business strategy and growth in many of our
businesses. The key drivers of our financial performance in 2012
were net interest and fee income growth, diversified sources of
fee income, a diversified loan portfolio and strong underlying
credit performance.
Revenue, the sum of net interest income and noninterest
income, was $86.1 billion in 2012, compared with $80.9 billion
in 2011 and $85.2 billion in 2010. In 2012, net interest income of
$43.2 billion represented 50% of revenue, compared with
$42.8 billion (53%) in 2011 and $44.8 billion (53%) in 2010. The
increase in revenue for 2012 was due to strong growth in
noninterest income, predominantly from mortgage banking.
Noninterest income was $42.9 billion in 2012, representing
50% of revenue, compared with $38.2 billion (47%) in 2011 and
$40.5 billion (47%) in 2010. The increase in 2012 was driven
predominantly by a 49% increase in mortgage banking income
due to increased net gains on mortgage loan origination/sales
activities, but also included higher trust and investment and
other fees on higher retail brokerage asset-based fees and strong
investment banking activity. Mortgage loan originations were
$524 billion in 2012, up from $357 billion a year ago.
Noninterest expense was $50.4 billion in 2012, compared
with $49.4 billion in 2011 and $50.5 billion in 2010. Noninterest
expense as a percentage of revenue (efficiency ratio) was 58.5%
in 2012, 61.0% in 2011 and 59.2% in 2010, reflecting our expense
management efforts and revenue growth in 2012. The increase in
noninterest expense from the prior year was due to increased
revenue generating activities and elevated operating losses and
other costs associated with mortgage servicing regulatory
consent orders, the IFR settlement, additional remediation-
related costs and the contribution to the Wells Fargo
Foundation.
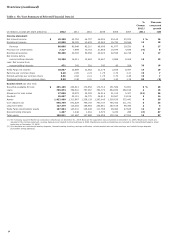
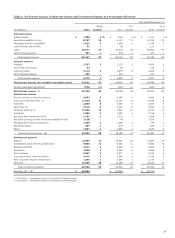
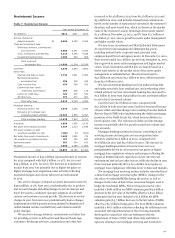
Table 3 presents the components of revenue and noninterest
expense as a percentage of revenue for year-over-year results.
34