Wells Fargo 2012 Annual Report Download - page 87
Download and view the complete annual report
Please find page 87 of the 2012 Wells Fargo annual report below. You can navigate through the pages in the report by either clicking on the pages listed below, or by using the keyword search tool below to find specific information within the annual report.-
 1
1 -
2
-
3
-
4
-
5
-
6
-
7
-
8
-
9
-
10
-
11
-
12
-
13
-
14
-
15
-
16
-
17
-
18
-
19
-
20
-
21
-
22
-
23
-
24
-
25
-
26
-
27
-
28
-
29
-
30
-
31
-
32
-
33
-
34
-
35
-
36
-
37
-
38
-
39
-
40
-
41
-
42
-
43
-
44
-
45
-
46
-
47
-
48
-
49
-
50
-
51
-
52
-
53
-
54
-
55
-
56
-
57
-
58
-
59
-
60
-
61
-
62
-
63
-
64
-
65
-
66
-
67
-
68
-
69
-
70
-
71
-
72
-
73
-
74
-
75
-
76
-
 77
77 -
 78
78 -
 79
79 -
 80
80 -
 81
81 -
 82
82 -
 83
83 -
 84
84 -
 85
85 -
 86
86 -
 87
87 -
 88
88 -
 89
89 -
 90
90 -
 91
91 -
 92
92 -
 93
93 -
 94
94 -
 95
95 -
 96
96 -
 97
97 -
98
-
99
-
100
-
101
-
102
-
103
-
104
-
105
-
106
-
107
-
108
-
109
-
110
-
111
-
112
-
113
-
114
-
115
-
116
-
117
-
118
-
119
-
120
-
121
-
122
-
123
-
124
-
125
-
126
-
127
-
128
-
129
-
130
-
131
-
132
-
133
-
134
-
135
-
136
-
137
-
138
-
139
-
140
-
141
-
142
-
143
-
144
-
145
-
146
-
147
-
148
-
149
-
150
-
151
-
152
-
153
-
154
-
155
-
156
-
157
-
158
-
159
-
160
-
161
-
162
-
163
-
164
-
165
-
166
-
167
-
168
-
169
-
170
-
171
-
172
-
173
-
174
-
175
-
176
-
177
-
178
-
179
-
180
-
181
-
182
-
183
-
184
-
185
-
186
-
187
-
188
-
189
-
190
-
191
-
192
-
193
-
194
-
195
-
196
-
197
-
198
-
199
-
200
-
201
-
202
-
203
-
204
-
205
-
206
-
207
-
208
-
209
-
210
-
211
-
212
-
213
-
214
-
215
-
216
-
217
-
218
-
219
-
220
-
221
-
222
-
223
-
224
-
225
-
226
-
227
-
228
-
229
-
230
-
231
-
232
-
233
-
234
-
235
-
236
-
237
-
238
-
239
-
240
-
241
-
242
-
243
-
244
-
245
-
246
-
247
-
248
-
249
-
250
-
251
-
252
 |
 |
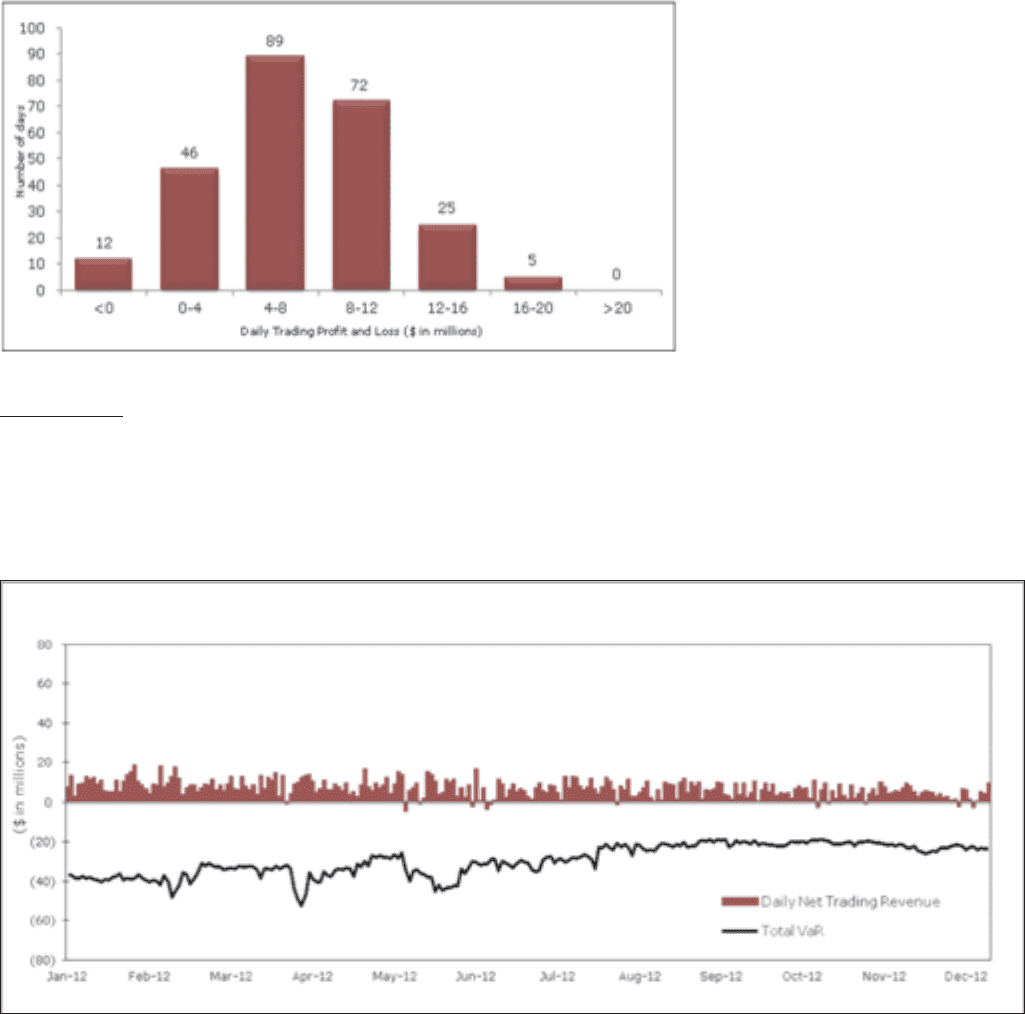
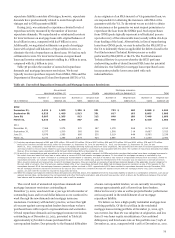
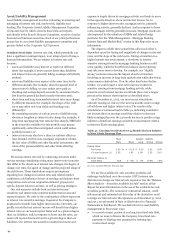
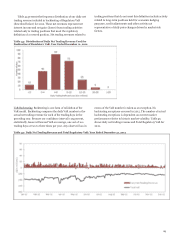
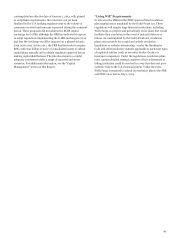
Table 44 presents the frequency distribution of our daily net
trading revenue included in backtesting of Regulatory VaR
(described below) for 2012. These net revenues represent net
interest income and net gains (losses) from trading activities
related only to trading positions that meet the regulatory
definition of a covered position. Net trading revenues related to
trading positions that do not meet this definition include activity
related to long-term positions held for economic hedging
purposes, credit adjustments and other activity not
representative of daily price changes driven by market risk
factors.
Table 44: Distribution of Daily Net Trading Revenue Used for
Backtesting of Regulatory VaR: Year Ended December 31, 2012
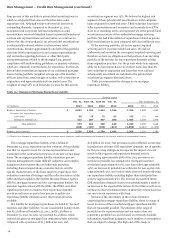
VaR Backtesting Backtesting is one form of validation of the
VaR model. Backtesting compares the daily VaR number to the
actual net trading revenue for each of the trading days in the
preceding year. Because our confidence interval is 99 percent,
statistically, losses will exceed VaR on average, one out of 1oo
trading days or two to three times per year. Any observed loss in
excess of the VaR number is taken as an exception. No
backtesting exceptions occurred in 2012. The number of actual
backtesting exceptions is dependent on current market
performance relative to historic market volatility. Table 45
shows daily net trading revenue and Total Regulatory VaR for
2012.
Table 45: Daily Net Trading Revenue and Total Regulatory VaR: Year Ended December 31, 2012
85