Wells Fargo 2012 Annual Report Download - page 74
Download and view the complete annual report
Please find page 74 of the 2012 Wells Fargo annual report below. You can navigate through the pages in the report by either clicking on the pages listed below, or by using the keyword search tool below to find specific information within the annual report.-
 1
1 -
2
-
3
-
4
-
5
-
6
-
7
-
8
-
9
-
10
-
11
-
12
-
13
-
14
-
15
-
16
-
17
-
18
-
19
-
20
-
21
-
22
-
23
-
24
-
25
-
26
-
27
-
28
-
29
-
30
-
31
-
32
-
33
-
34
-
35
-
36
-
37
-
38
-
39
-
40
-
41
-
42
-
43
-
44
-
45
-
46
-
47
-
48
-
49
-
50
-
51
-
52
-
53
-
54
-
55
-
56
-
57
-
58
-
59
-
60
-
61
-
62
-
63
-
 64
64 -
 65
65 -
 66
66 -
 67
67 -
 68
68 -
 69
69 -
 70
70 -
 71
71 -
 72
72 -
 73
73 -
 74
74 -
 75
75 -
 76
76 -
 77
77 -
 78
78 -
 79
79 -
 80
80 -
 81
81 -
 82
82 -
 83
83 -
 84
84 -
85
-
86
-
87
-
88
-
89
-
90
-
91
-
92
-
93
-
94
-
95
-
96
-
97
-
98
-
99
-
100
-
101
-
102
-
103
-
104
-
105
-
106
-
107
-
108
-
109
-
110
-
111
-
112
-
113
-
114
-
115
-
116
-
117
-
118
-
119
-
120
-
121
-
122
-
123
-
124
-
125
-
126
-
127
-
128
-
129
-
130
-
131
-
132
-
133
-
134
-
135
-
136
-
137
-
138
-
139
-
140
-
141
-
142
-
143
-
144
-
145
-
146
-
147
-
148
-
149
-
150
-
151
-
152
-
153
-
154
-
155
-
156
-
157
-
158
-
159
-
160
-
161
-
162
-
163
-
164
-
165
-
166
-
167
-
168
-
169
-
170
-
171
-
172
-
173
-
174
-
175
-
176
-
177
-
178
-
179
-
180
-
181
-
182
-
183
-
184
-
185
-
186
-
187
-
188
-
189
-
190
-
191
-
192
-
193
-
194
-
195
-
196
-
197
-
198
-
199
-
200
-
201
-
202
-
203
-
204
-
205
-
206
-
207
-
208
-
209
-
210
-
211
-
212
-
213
-
214
-
215
-
216
-
217
-
218
-
219
-
220
-
221
-
222
-
223
-
224
-
225
-
226
-
227
-
228
-
229
-
230
-
231
-
232
-
233
-
234
-
235
-
236
-
237
-
238
-
239
-
240
-
241
-
242
-
243
-
244
-
245
-
246
-
247
-
248
-
249
-
250
-
251
-
252
 |
 |
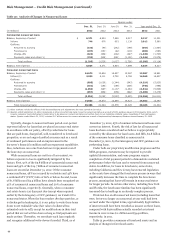
Risk Management – Credit Risk Management (continued)
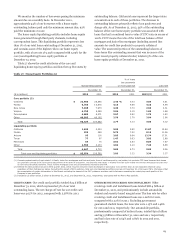
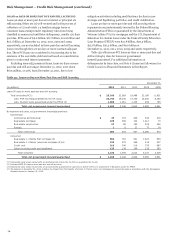
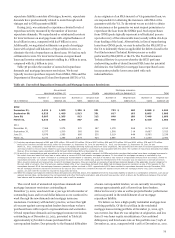
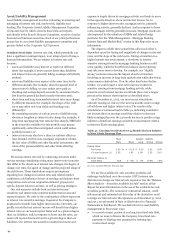
Table 36 presents net charge-offs for the four quarters and
full year of 2012 and 2011. Net charge-offs in 2012 were
$9.0 billion (1.17% of average total loans outstanding) compared
with $11.3 billion (1.49%) in 2011. Net charge-offs in 2012
included $888 million resulting from the OCC guidance issued
in third quarter 2012. Excluding the impact of this guidance, net
charge-offs in 2012 were $8.1 billion (1.05% of average total
loans outstanding), and total net charge-offs as a percentage of
average loans decreased in each of the four quarters of the year,
as we saw signs of stabilization in the housing market although
the economic recovery remained uneven.
Net charge-offs in the real estate 1-4 family first mortgage
portfolio totaled $2.9 billion in 2012, compared with $3.5 billion
a year ago.
Net charge-offs in the real estate 1-4 family junior lien
portfolio decreased $367 million to $3.2 billion in 2012. More
information about the home equity portfolio, which includes
substantially all of our real estate 1-4 family junior lien mortgage
loans, is available in Table 27 of this Report and the related
discussion.
Credit card net charge-offs decreased $282 million to
$916 million in 2012.
Commercial net charge-offs were $1.2 billion in 2012
compared with $2.0 billion in 2011, as market liquidity and
improving market conditions helped stabilize performance
results.
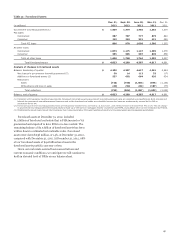
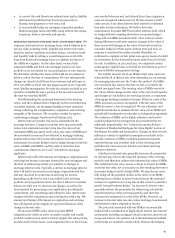
ALLOWANCE FOR CREDIT LOSSES The allowance for credit
losses, which consists of the allowance for loan losses and the
allowance for unfunded credit commitments, is management’s
estimate of credit losses inherent in the loan portfolio and
unfunded credit commitments at the balance sheet date,
excluding loans carried at fair value. The detail of the changes in
the allowance for credit losses by portfolio segment (including
charge-offs and recoveries by loan class) is in Note 6 (Loans and
Allowance for Credit Losses) to Financial Statements in this
Report.
We employ a disciplined process and methodology to
establish our allowance for credit losses each quarter. This
process takes into consideration many factors, including
historical and forecasted loss trends, loan-level credit quality
ratings and loan grade-specific loss factors. The process involves
subjective and complex judgments. In addition, we review a
variety of credit metrics and trends. These credit metrics and
trends, however, do not solely determine the amount of the
allowance as we use several analytical tools. For additional
information on our allowance for credit losses, see the “Critical
Accounting Policies – Allowance for Credit Losses” section,
Note 1 (Summary of Significant Accounting Policies) and Note 6
(Loans and Allowance for Credit Losses) to Financial Statements
in this Report.
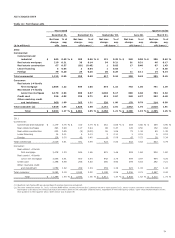
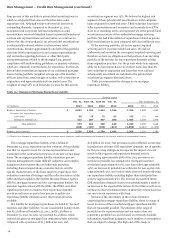
Table 37 presents an analysis of the allowance for credit
losses by loan segments and classes for the last five years.
72