Wells Fargo 2012 Annual Report Download - page 182
Download and view the complete annual report
Please find page 182 of the 2012 Wells Fargo annual report below. You can navigate through the pages in the report by either clicking on the pages listed below, or by using the keyword search tool below to find specific information within the annual report.-
 1
1 -
2
-
3
-
4
-
5
-
6
-
7
-
8
-
9
-
10
-
11
-
12
-
13
-
14
-
15
-
16
-
17
-
18
-
19
-
20
-
21
-
22
-
23
-
24
-
25
-
26
-
27
-
28
-
29
-
30
-
31
-
32
-
33
-
34
-
35
-
36
-
37
-
38
-
39
-
40
-
41
-
42
-
43
-
44
-
45
-
46
-
47
-
48
-
49
-
50
-
51
-
52
-
53
-
54
-
55
-
56
-
57
-
58
-
59
-
60
-
61
-
62
-
63
-
64
-
65
-
66
-
67
-
68
-
69
-
70
-
71
-
72
-
73
-
74
-
75
-
76
-
77
-
78
-
79
-
80
-
81
-
82
-
83
-
84
-
85
-
86
-
87
-
88
-
89
-
90
-
91
-
92
-
93
-
94
-
95
-
96
-
97
-
98
-
99
-
100
-
101
-
102
-
103
-
104
-
105
-
106
-
107
-
108
-
109
-
110
-
111
-
112
-
113
-
114
-
115
-
116
-
117
-
118
-
119
-
120
-
121
-
122
-
123
-
124
-
125
-
126
-
127
-
128
-
129
-
130
-
131
-
132
-
133
-
134
-
135
-
136
-
137
-
138
-
139
-
140
-
141
-
142
-
143
-
144
-
145
-
146
-
147
-
148
-
149
-
150
-
151
-
152
-
153
-
154
-
155
-
156
-
157
-
158
-
159
-
160
-
161
-
162
-
163
-
164
-
165
-
166
-
167
-
168
-
169
-
170
-
171
-
 172
172 -
 173
173 -
 174
174 -
 175
175 -
 176
176 -
 177
177 -
 178
178 -
 179
179 -
 180
180 -
 181
181 -
 182
182 -
 183
183 -
 184
184 -
 185
185 -
 186
186 -
 187
187 -
 188
188 -
 189
189 -
 190
190 -
 191
191 -
 192
192 -
193
-
194
-
195
-
196
-
197
-
198
-
199
-
200
-
201
-
202
-
203
-
204
-
205
-
206
-
207
-
208
-
209
-
210
-
211
-
212
-
213
-
214
-
215
-
216
-
217
-
218
-
219
-
220
-
221
-
222
-
223
-
224
-
225
-
226
-
227
-
228
-
229
-
230
-
231
-
232
-
233
-
234
-
235
-
236
-
237
-
238
-
239
-
240
-
241
-
242
-
243
-
244
-
245
-
246
-
247
-
248
-
249
-
250
-
251
-
252
 |
 |

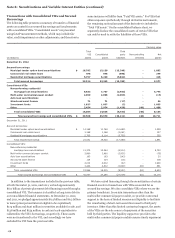
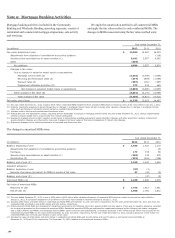
Note 9: Mortgage Banking Activities
Mortgage banking activities, included in the Community
Banking and Wholesale Banking operating segments, consist of
residential and commercial mortgage originations, sale activity
and servicing.
We apply the amortization method to all commercial MSRs
and apply the fair value method to only residential MSRs. The
changes in MSRs measured using the fair value method were:
Year ended December 31,
(in millions) 2012 2011 2010
Fair value, beginning of year $ 12,603 14,467 16,004
Adjustments from adoption of consolidation accounting guidance - - (118)
Servicing from securitizations or asset transfers (1) 5,182 3,957 4,092
Sales (293) - -
Net additions 4,889 3,957 3,974
Changes in fair value:
Due to changes in valuation model inputs or assumptions:
Mortgage interest rates (2) (2,092) (3,749) (1,944)
Servicing and foreclosure costs (3) (677) (694) (1,095)
Discount rates (4) (397) (150) (387)
Prepayment estimates and other (5) 273 913 469
Net changes in valuation model inputs or assumptions (2,893) (3,680) (2,957)
Other changes in fair value (6) (3,061) (2,141) (2,554)
Total changes in fair value (5,954) (5,821) (5,511)
Fair value, end of year $ 11,538 12,603 14,467
(1) The year ended December 31, 2012, includes $315 million residential MSRs transferred from amortized MSRs that we elected to carry at fair value effective January 1, 2012.
(2) Primarily represents prepayment speed changes due to changes in mortgage interest rates, but also includes other valuation changes due to changes in mortgage interest
rates (such as changes in estimated interest earned on custodial deposit balances).
(3) Includes costs to service and unreimbursed foreclosure costs.
(4) Reflects discount rate assumption change, excluding portion attributable to changes in mortgage interest rates; the year ended December 31, 2012, change predominantly
reflects increased capital return requirements from market participants.
(5) Represents changes driven by other valuation model inputs or assumptions including prepayment speed estimation changes and other assumption updates. Prepayment
speed estimation changes are influenced by observed changes in borrower behavior that occur independent of interest rate changes.
(6) Represents changes due to collection/realization of expected cash flows over time.
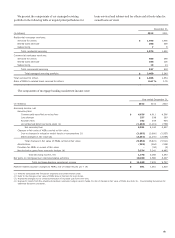
The changes in amortized MSRs were:
Year ended December 31,
(in millions) 2012 2011 2010
Balance, beginning of year $ 1,445 1,422 1,119
Adjustments from adoption of consolidation accounting guidance - - (5)
Purchases 177 155 58
Servicing from securitizations or asset transfers (1) (229) 132 478
Amortization (2) (233) (264) (228)
Balance, end of year (2) 1,160 1,445 1,422
Valuation allowance:
Balance, beginning of year (37) (3) -
Reversal of provision (provision) for MSRs in excess of fair value 37 (34) (3)
Balance, end of year (3) - (37) (3)
Amortized MSRs, net $ 1,160 1,408 1,419
Fair value of amortized MSRs:
Beginning of year $ 1,756 1,812 1,261
End of year (4) 1,400 1,756 1,812
(1) The year ended December 31, 2012, is net of $350 million ($313 million after valuation allowance) of residential MSRs that we elected to carry at fair value effective
January 1, 2012. A cumulative adjustment of $2 million to fair value was recorded in retained earnings at January 1, 2012.
(2) Includes $350 million and $400 million in residential amortized MSRs at December 31, 2011 and 2010, respectively. For the years ended December 31, 2011 and 2010, the
residential MSR amortization was $(50) million and $(5) million, respectively.
(3) Commercial amortized MSRs are evaluated for impairment purposes by the following risk strata: agency (GSEs) and non-agency. There was no valuation allowance recorded
for the periods presented on the commercial amortized MSRs. Residential amortized MSRs are evaluated for impairment purposes by the following risk strata: mortgages
sold to GSEs (FHLMC and FNMA) and mortgages sold to GNMA, each by interest rate stratifications. A valuation allowance of $37 million and $3 million was recorded on the
residential amortized MSRs for the years ended December 31, 2011 and 2010, respectively. For the year ended December 31, 2012, valuation allowance of $37 million for
residential MSRs was reversed upon election to carry at fair value.
(4) Includes fair value of $316 million and $441 million in residential amortized MSRs and $1,440 million and $1,371 million in commercial amortized MSRs at
December 31, 2011 and 2010, respectively. The December 31, 2012, balance is all commercial amortized MSRs.
180