Wells Fargo 2012 Annual Report Download - page 37
Download and view the complete annual report
Please find page 37 of the 2012 Wells Fargo annual report below. You can navigate through the pages in the report by either clicking on the pages listed below, or by using the keyword search tool below to find specific information within the annual report.-
 1
1 -
2
-
3
-
4
-
5
-
6
-
7
-
8
-
9
-
10
-
11
-
12
-
13
-
14
-
15
-
16
-
17
-
18
-
19
-
20
-
21
-
22
-
23
-
24
-
25
-
26
-
 27
27 -
 28
28 -
 29
29 -
 30
30 -
 31
31 -
 32
32 -
 33
33 -
 34
34 -
 35
35 -
 36
36 -
 37
37 -
 38
38 -
 39
39 -
 40
40 -
 41
41 -
 42
42 -
 43
43 -
 44
44 -
 45
45 -
 46
46 -
 47
47 -
48
-
49
-
50
-
51
-
52
-
53
-
54
-
55
-
56
-
57
-
58
-
59
-
60
-
61
-
62
-
63
-
64
-
65
-
66
-
67
-
68
-
69
-
70
-
71
-
72
-
73
-
74
-
75
-
76
-
77
-
78
-
79
-
80
-
81
-
82
-
83
-
84
-
85
-
86
-
87
-
88
-
89
-
90
-
91
-
92
-
93
-
94
-
95
-
96
-
97
-
98
-
99
-
100
-
101
-
102
-
103
-
104
-
105
-
106
-
107
-
108
-
109
-
110
-
111
-
112
-
113
-
114
-
115
-
116
-
117
-
118
-
119
-
120
-
121
-
122
-
123
-
124
-
125
-
126
-
127
-
128
-
129
-
130
-
131
-
132
-
133
-
134
-
135
-
136
-
137
-
138
-
139
-
140
-
141
-
142
-
143
-
144
-
145
-
146
-
147
-
148
-
149
-
150
-
151
-
152
-
153
-
154
-
155
-
156
-
157
-
158
-
159
-
160
-
161
-
162
-
163
-
164
-
165
-
166
-
167
-
168
-
169
-
170
-
171
-
172
-
173
-
174
-
175
-
176
-
177
-
178
-
179
-
180
-
181
-
182
-
183
-
184
-
185
-
186
-
187
-
188
-
189
-
190
-
191
-
192
-
193
-
194
-
195
-
196
-
197
-
198
-
199
-
200
-
201
-
202
-
203
-
204
-
205
-
206
-
207
-
208
-
209
-
210
-
211
-
212
-
213
-
214
-
215
-
216
-
217
-
218
-
219
-
220
-
221
-
222
-
223
-
224
-
225
-
226
-
227
-
228
-
229
-
230
-
231
-
232
-
233
-
234
-
235
-
236
-
237
-
238
-
239
-
240
-
241
-
242
-
243
-
244
-
245
-
246
-
247
-
248
-
249
-
250
-
251
-
252
 |
 |

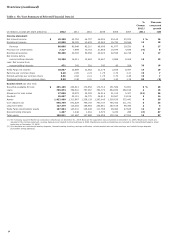
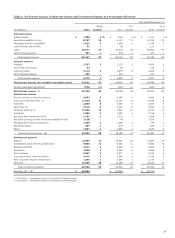
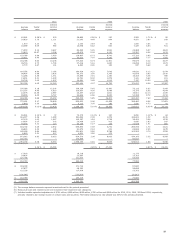
Table 3: Net Interest Income, Noninterest Income and Noninterest Expense as a Percentage of Revenue
Year ended December 31,
% o
f
% of % of
(in millions) 2012 revenue 2011 revenue 2010 revenue
Interest income
Trading assets $ 1,380 2 % $ 1,463 2 % $ 1,121 1 %
Securities available for sale 8,757 10 9,107 11 10,236 12
Mortgages held for sale (MHFS) 1,825 2 1,644 2 1,736 2
Loans held for sale (LHFS) 41 - 58 - 101 -
Loans 36,517 42 37,302 46 39,808 47
Other interest income 587 1 548 1 437 1
Total interest income 49,107 57 50,122 62 53,439 63
Interest expense
Deposits 1,727 2 2,275 3 2,832 3
Short-term borrowings 94 - 94 - 106 -
Long-term debt 3,110 4 3,978 5 4,888 6
Other interest expense 245 - 316 - 227 -
Total interest expense 5,176 6 6,663 8 8,053 9
Net interest income (on a taxable-equivalent basis) 43,931 51 43,459 54 45,386 54
Taxable-equivalent adjustment (701) (1) (696) (1) (629) (1)
Net interest income (A) 43,230 50 42,763 53 44,757 53
Noninterest income
Service charges on deposit accounts 4,683 5 4,280 5 4,916 6
Trust and investment fees (1) 11,890 14 11,304 14 10,934 12
Card fees 2,838 3 3,653 5 3,652 4
Other fees (1) 4,519 5 4,193 5 3,990 5
Mortgage banking (1) 11,638 14 7,832 10 9,737 11
Insurance 1,850 2 1,960 2 2,126 2
Net gains from trading activities 1,707 2 1,014 1 1,648 2
Net gains (losses) on debt securities available for sale (128) - 54 - (324) -
Net gains from equity investments 1,485 2 1,482 2 779 1
Operating leases 567 1 524 1 815 1
Other 1,807 2 1,889 2 2,180 3
Total noninterest income (B) 42,856 50 38,185 47 40,453 47
Noninterest expense
Salaries 14,689 17 14,462 18 13,869 16
Commission and incentive compensation 9,504 11 8,857 11 8,692 10
Employee benefits 4,611 6 4,348 5 4,651 5
Equipment 2,068 2 2,283 3 2,636 3
Net occupancy 2,857 3 3,011 4 3,030 4
Core deposit and other intangibles 1,674 2 1,880 2 2,199 3
FDIC and other deposit assessments 1,356 2 1,266 2 1,197 1
Other (2) 13,639 16 13,286 16 14,182 17
Total noninterest expense 50,398 59 49,393 61 50,456 59
Revenue (A) + (B) $ 86,086 $ 80,948 $ 85,210
(1)
See Table 7 – Noninterest Income in this Report for additional detail.
(2) See Table 8 – Noninterest Expense in this Report for additional detail.
35