Wells Fargo 2012 Annual Report Download - page 189
Download and view the complete annual report
Please find page 189 of the 2012 Wells Fargo annual report below. You can navigate through the pages in the report by either clicking on the pages listed below, or by using the keyword search tool below to find specific information within the annual report.-
 1
1 -
2
-
3
-
4
-
5
-
6
-
7
-
8
-
9
-
10
-
11
-
12
-
13
-
14
-
15
-
16
-
17
-
18
-
19
-
20
-
21
-
22
-
23
-
24
-
25
-
26
-
27
-
28
-
29
-
30
-
31
-
32
-
33
-
34
-
35
-
36
-
37
-
38
-
39
-
40
-
41
-
42
-
43
-
44
-
45
-
46
-
47
-
48
-
49
-
50
-
51
-
52
-
53
-
54
-
55
-
56
-
57
-
58
-
59
-
60
-
61
-
62
-
63
-
64
-
65
-
66
-
67
-
68
-
69
-
70
-
71
-
72
-
73
-
74
-
75
-
76
-
77
-
78
-
79
-
80
-
81
-
82
-
83
-
84
-
85
-
86
-
87
-
88
-
89
-
90
-
91
-
92
-
93
-
94
-
95
-
96
-
97
-
98
-
99
-
100
-
101
-
102
-
103
-
104
-
105
-
106
-
107
-
108
-
109
-
110
-
111
-
112
-
113
-
114
-
115
-
116
-
117
-
118
-
119
-
120
-
121
-
122
-
123
-
124
-
125
-
126
-
127
-
128
-
129
-
130
-
131
-
132
-
133
-
134
-
135
-
136
-
137
-
138
-
139
-
140
-
141
-
142
-
143
-
144
-
145
-
146
-
147
-
148
-
149
-
150
-
151
-
152
-
153
-
154
-
155
-
156
-
157
-
158
-
159
-
160
-
161
-
162
-
163
-
164
-
165
-
166
-
167
-
168
-
169
-
170
-
171
-
172
-
173
-
174
-
175
-
176
-
177
-
178
-
 179
179 -
 180
180 -
 181
181 -
 182
182 -
 183
183 -
 184
184 -
 185
185 -
 186
186 -
 187
187 -
 188
188 -
 189
189 -
 190
190 -
 191
191 -
 192
192 -
 193
193 -
 194
194 -
 195
195 -
 196
196 -
 197
197 -
 198
198 -
 199
199 -
200
-
201
-
202
-
203
-
204
-
205
-
206
-
207
-
208
-
209
-
210
-
211
-
212
-
213
-
214
-
215
-
216
-
217
-
218
-
219
-
220
-
221
-
222
-
223
-
224
-
225
-
226
-
227
-
228
-
229
-
230
-
231
-
232
-
233
-
234
-
235
-
236
-
237
-
238
-
239
-
240
-
241
-
242
-
243
-
244
-
245
-
246
-
247
-
248
-
249
-
250
-
251
-
252
 |
 |
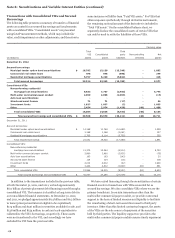
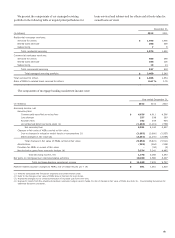
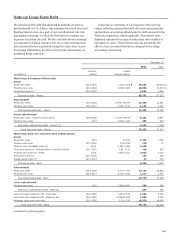
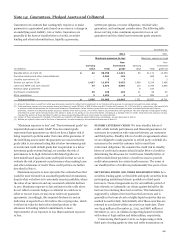
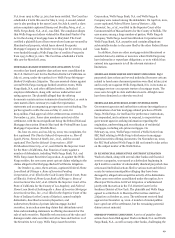
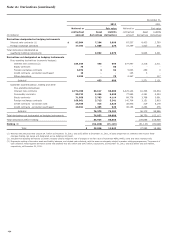
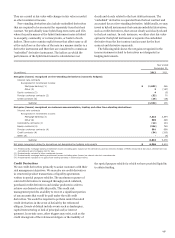
Note 14: Guarantees, Pledged Assets and Collateral
Guarantees are contracts that contingently require us to make
payments to a guaranteed party based on an event or a change in
an underlying asset, liability, rate or index. Guarantees are
generally in the form of standby letters of credit, securities
lending and other indemnifications, liquidity agreements,
written put options, recourse obligations, residual value
guarantees, and contingent consideration. The following table
shows carrying value, maximum exposure to loss on our
guarantees and the related non-investment grade amounts.
December 31,
2012 2011
Maximum exposure to loss Maximum exposure to loss
Non- Non-
Carrying investment Carrying investment
(in millions) value Total grade value Total grade (1)
Standby letters of credit (2) $ 42 39,759 11,331 85 41,171 13,250
Securities lending and other indemnifications - 2,541 118 - 669 62
Liquidity agreements (3) - 3 3 - 2 2
Written put options (3)(4) 1,427 11,874 3,953 1,469 8,224 2,466
Loans and MHFS sold with recourse 99 5,873 3,905 102 5,784 3,850
Residual value guarantees - - - 8 197 -
Contingent consideration 35 129 129 31 98 97
Other guarantees 3 1,421 4 6 552 4
Total guarantees $ 1,606 61,600 19,443 1,701 56,697 19,731
(1) Amounts have been revised from what was previously reported to reflect better alignment of our internal rating process to external noninvestment grade ratings.
(2) Total maximum exposure to loss includes direct pay letters of credit (DPLCs) of $18.5 billion and $19.7 billion at December 31, 2012 and 2011, respectively. We issue DPLCs
to provide credit enhancements for certain bond issuances. Beneficiaries (bond trustees) may draw upon these instruments to make scheduled principal and interest
payments, redeem all outstanding bonds because a default event has occurred, or for other reasons as permitted by the agreement. We also originate multipurpose lending
commitments under which borrowers have the option to draw on the facility in one of several forms, including as a standby letter of credit. Total maximum exposure to loss
includes the portion of these facilities for which we have issued standby letters of credit under the commitments.
(3) Certain of these agreements included in this table are related to off-balance sheet entities and, accordingly, are also disclosed in Note 8.
(4) Written put options, which are in the form of derivatives, are also included in the derivative disclosures in Note 16.
“Maximum exposure to loss” and “Non-investment grade” are
required disclosures under GAAP. Non-investment grade
represents those guarantees on which we have a higher risk of
being required to perform under the terms of the guarantee. If
the underlying assets under the guarantee are non-investment
grade (that is, an external rating that is below investment grade
or an internal credit default grade that is equivalent to a below
investment grade external rating), we consider the risk of
performance to be high. Internal credit default grades are
determined based upon the same credit policies that we use to
evaluate the risk of payment or performance when making loans
and other extensions of credit. These credit policies are further
described in Note 6.
Maximum exposure to loss represents the estimated loss that
would be incurred under an assumed hypothetical circumstance,
despite what we believe is its extremely remote possibility, where
the value of our interests and any associated collateral declines
to zero. Maximum exposure to loss estimates in the table above
do not reflect economic hedges or collateral we could use to
offset or recover losses we may incur under our guarantee
agreements. Accordingly, this required disclosure is not an
indication of expected loss. We believe the carrying value, which
is either fair value for derivative related products or the
allowance for lending related commitments, is more
representative of our exposure to loss than maximum exposure
to loss.
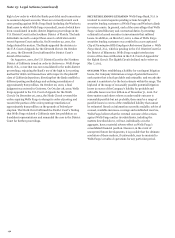
STANDBY LETTERS OF CREDIT We issue standby letters of
credit, which include performance and financial guarantees, for
customers in connection with contracts between our customers
and third parties. Standby letters of credit are agreements where
we are obligated to make payment to a third party on behalf of a
customer in the event the customer fails to meet their
contractual obligations. We consider the credit risk in standby
letters of credit and commercial and similar letters of credit in
determining the allowance for credit losses. Standby letters of
credit include direct pay letters of credit we issue to provide
credit enhancements for certain bond issuances. The terms of
our standby letters of credit are predominantly five years or less.
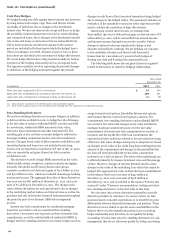
SECURITIES LENDING AND OTHER INDEMNIFICATIONS As a
securities lending agent, we lend debt and equity securities from
participating institutional clients’ portfolios to third-party
borrowers. These arrangements are for an indefinite period of
time whereby we indemnify our clients against default by the
borrower in returning these lent securities. This indemnity is
supported by collateral received from the borrowers and is
generally in the form of cash or highly liquid securities that are
marked to market daily. Substantially all of these securities are
returned to our clients within one year from trade date. There
was $443 million at December 31, 2012, and $687 million at
December 31, 2011, in collateral supporting loaned securities
with values of $436 million and $669 million, respectively.
Commencing third quarter 2012, we began using certain
third party clearing agents to clear and settle transactions on
187