Wells Fargo 2012 Annual Report Download - page 229
Download and view the complete annual report
Please find page 229 of the 2012 Wells Fargo annual report below. You can navigate through the pages in the report by either clicking on the pages listed below, or by using the keyword search tool below to find specific information within the annual report.-
 1
1 -
2
-
3
-
4
-
5
-
6
-
7
-
8
-
9
-
10
-
11
-
12
-
13
-
14
-
15
-
16
-
17
-
18
-
19
-
20
-
21
-
22
-
23
-
24
-
25
-
26
-
27
-
28
-
29
-
30
-
31
-
32
-
33
-
34
-
35
-
36
-
37
-
38
-
39
-
40
-
41
-
42
-
43
-
44
-
45
-
46
-
47
-
48
-
49
-
50
-
51
-
52
-
53
-
54
-
55
-
56
-
57
-
58
-
59
-
60
-
61
-
62
-
63
-
64
-
65
-
66
-
67
-
68
-
69
-
70
-
71
-
72
-
73
-
74
-
75
-
76
-
77
-
78
-
79
-
80
-
81
-
82
-
83
-
84
-
85
-
86
-
87
-
88
-
89
-
90
-
91
-
92
-
93
-
94
-
95
-
96
-
97
-
98
-
99
-
100
-
101
-
102
-
103
-
104
-
105
-
106
-
107
-
108
-
109
-
110
-
111
-
112
-
113
-
114
-
115
-
116
-
117
-
118
-
119
-
120
-
121
-
122
-
123
-
124
-
125
-
126
-
127
-
128
-
129
-
130
-
131
-
132
-
133
-
134
-
135
-
136
-
137
-
138
-
139
-
140
-
141
-
142
-
143
-
144
-
145
-
146
-
147
-
148
-
149
-
150
-
151
-
152
-
153
-
154
-
155
-
156
-
157
-
158
-
159
-
160
-
161
-
162
-
163
-
164
-
165
-
166
-
167
-
168
-
169
-
170
-
171
-
172
-
173
-
174
-
175
-
176
-
177
-
178
-
179
-
180
-
181
-
182
-
183
-
184
-
185
-
186
-
187
-
188
-
189
-
190
-
191
-
192
-
193
-
194
-
195
-
196
-
197
-
198
-
199
-
200
-
201
-
202
-
203
-
204
-
205
-
206
-
207
-
208
-
209
-
210
-
211
-
212
-
213
-
214
-
215
-
216
-
217
-
218
-
 219
219 -
 220
220 -
 221
221 -
 222
222 -
 223
223 -
 224
224 -
 225
225 -
 226
226 -
 227
227 -
 228
228 -
 229
229 -
 230
230 -
 231
231 -
 232
232 -
 233
233 -
 234
234 -
 235
235 -
 236
236 -
 237
237 -
 238
238 -
 239
239 -
240
-
241
-
242
-
243
-
244
-
245
-
246
-
247
-
248
-
249
-
250
-
251
-
252
 |
 |

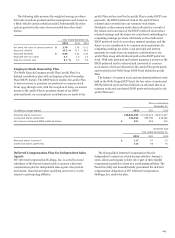
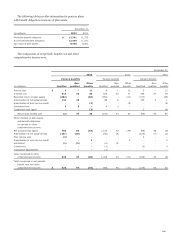
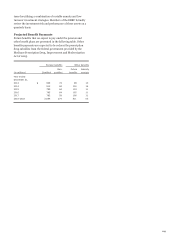
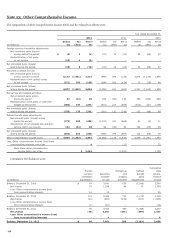
The following table provides information for pension plans
with benefit obligations in excess of plan assets.
December 31,
(in millions) 2012 2011
Projected benefit obligation $ 12,391 11,325
Accumulated benefit obligation 12,389 11,321
Fair value of plan assets 9,490 9,061
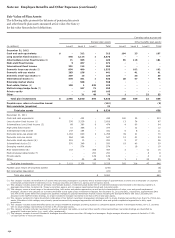
The components of net periodic benefit cost and other
comprehensive income were:
December 31,
2012 2011 2010
Pension benefits Pension benefits Pension benefits
Non- Other Non- Other Non- Other
(in millions) Qualified qualified benefits Qualified qualified benefits Qualified qualified benefits
Service cost $ 3 - 11 6 1 13 5 - 13
Interest cost 514 32 60 520 34 71 554 37 78
Expected return on plan assets (652) - (36) (759) - (41) (717) - (29)
Amortization of net actuarial loss 131 10 - 86 6 - 105 3 1
Amortization of prior service credit - - (2) - - (3) - - (4)
Settlement loss 2 5 - 4 3 - - - -
Curtailment loss (gain) - - (3) - - - 3 - (4)
Net periodic benefit cost (2) 47 30 (143) 44 40 (50) 40 55
Other changes in plan assets
and benefit obligations
recognized in other
comprehensive income:
Net actuarial loss (gain) 758 62 (42) 1,120 33 (74) (59) 46 (9)
Amortization of net actuarial loss (131) (10) - (86) (6) - (105) (3) (1)
Prior service cost (2) - - - - - 2 - -
Amortization of prior service credit - - 2 - - 3 - - 4
Settlement (1) (5) - (4) (3) - - - -
Curtailment - - - (3) - - (3) - 4
Translation adjustments - - - (1) - - - - -
Total recognized in other
comprehensive income 624 47 (40) 1,026 24 (71) (165) 43 (2)
Total recognized in net periodic
benefit cost and other
comprehensive income $ 622 94 (10) 883 68 (31) (215) 83 53
227