Wells Fargo 2012 Annual Report Download - page 166
Download and view the complete annual report
Please find page 166 of the 2012 Wells Fargo annual report below. You can navigate through the pages in the report by either clicking on the pages listed below, or by using the keyword search tool below to find specific information within the annual report.-
 1
1 -
2
-
3
-
4
-
5
-
6
-
7
-
8
-
9
-
10
-
11
-
12
-
13
-
14
-
15
-
16
-
17
-
18
-
19
-
20
-
21
-
22
-
23
-
24
-
25
-
26
-
27
-
28
-
29
-
30
-
31
-
32
-
33
-
34
-
35
-
36
-
37
-
38
-
39
-
40
-
41
-
42
-
43
-
44
-
45
-
46
-
47
-
48
-
49
-
50
-
51
-
52
-
53
-
54
-
55
-
56
-
57
-
58
-
59
-
60
-
61
-
62
-
63
-
64
-
65
-
66
-
67
-
68
-
69
-
70
-
71
-
72
-
73
-
74
-
75
-
76
-
77
-
78
-
79
-
80
-
81
-
82
-
83
-
84
-
85
-
86
-
87
-
88
-
89
-
90
-
91
-
92
-
93
-
94
-
95
-
96
-
97
-
98
-
99
-
100
-
101
-
102
-
103
-
104
-
105
-
106
-
107
-
108
-
109
-
110
-
111
-
112
-
113
-
114
-
115
-
116
-
117
-
118
-
119
-
120
-
121
-
122
-
123
-
124
-
125
-
126
-
127
-
128
-
129
-
130
-
131
-
132
-
133
-
134
-
135
-
136
-
137
-
138
-
139
-
140
-
141
-
142
-
143
-
144
-
145
-
146
-
147
-
148
-
149
-
150
-
151
-
152
-
153
-
154
-
155
-
 156
156 -
 157
157 -
 158
158 -
 159
159 -
 160
160 -
 161
161 -
 162
162 -
 163
163 -
 164
164 -
 165
165 -
 166
166 -
 167
167 -
 168
168 -
 169
169 -
 170
170 -
 171
171 -
 172
172 -
 173
173 -
 174
174 -
 175
175 -
 176
176 -
177
-
178
-
179
-
180
-
181
-
182
-
183
-
184
-
185
-
186
-
187
-
188
-
189
-
190
-
191
-
192
-
193
-
194
-
195
-
196
-
197
-
198
-
199
-
200
-
201
-
202
-
203
-
204
-
205
-
206
-
207
-
208
-
209
-
210
-
211
-
212
-
213
-
214
-
215
-
216
-
217
-
218
-
219
-
220
-
221
-
222
-
223
-
224
-
225
-
226
-
227
-
228
-
229
-
230
-
231
-
232
-
233
-
234
-
235
-
236
-
237
-
238
-
239
-
240
-
241
-
242
-
243
-
244
-
245
-
246
-
247
-
248
-
249
-
250
-
251
-
252
 |
 |

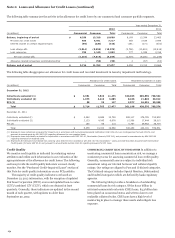
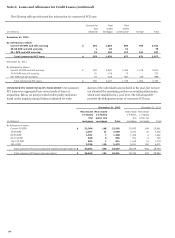
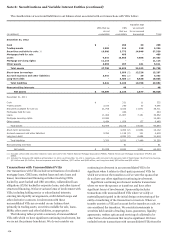
Note 6: Loans and Allowance for Credit Losses (continued)
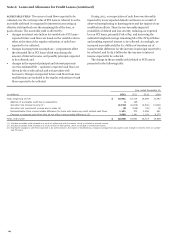
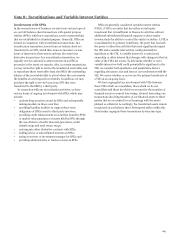
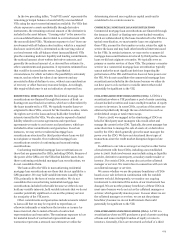
ACCRETABLE YIELD The excess of cash flows expected to be
collected over the carrying value of PCI loans is referred to as the
accretable yield and is recognized in interest income using an
effective yield method over the remaining life of the loan, or
pools of loans. The accretable yield is affected by:
x changes in interest rate indices for variable rate PCI loans –
expected future cash flows are based on the variable rates in
effect at the time of the regular evaluations of cash flows
expected to be collected;
x changes in prepayment assumptions – prepayments affect
the estimated life of PCI loans which may change the
amount of interest income, and possibly principal, expected
to be collected; and
x changes in the expected principal and interest payments
over the estimated life – updates to expected cash flows are
driven by the credit outlook and actions taken with
borrowers. Changes in expected future cash flows from loan
modifications are included in the regular evaluations of cash
flows expected to be collected.
During 2012, our expectation of cash flows was favorably
impacted by lower expected defaults and losses as a result of
observed strengthening in housing prices and the impact of our
modification efforts. These factors favorably impacted
probability of default and loss severity, reducing our expected
loss on PCI loans, primarily Pick-a-Pay, and increasing the
estimated weighted-average remaining life of the PCI portfolios
and resulting expected interest to be collected. Accordingly, we
increased accretable yield for $1.1 billion of transfers out of
nonaccretable difference for the increase in principal expected to
be collected, and by $3.6 billion for the increase in interest
income expected to be collected.
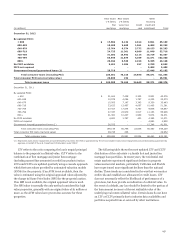
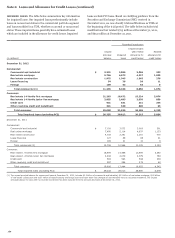
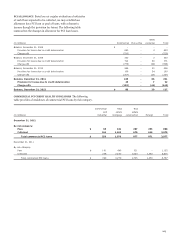
The change in the accretable yield related to PCI loans is
presented in the following table.
Year ended December 31,
(in millions) 2012 2011 2010 2009
Total, beginning of year $ 15,961 16,714 14,559 10,447
Addition of accretable yield due to acquisitions 3 128 - -
Accretion into interest income (1) (2,152) (2,206) (2,392) (2,601)
Accretion into noninterest income due to sales (2) (5) (189) (43) (5)
Reclassification from nonaccretable difference for loans with improving credit-related cash flows 1,141 373 3,399 441
Changes in expected cash flows that do not affect nonaccretable difference (3) 3,600 1,141 1,191 6,277
Total, end of year $ 18,548 15,961 16,714 14,559
(1) Includes accretable yield released as a result of settlements with borrowers, which is included in interest income.
(2) Includes accretable yield released as a result of sales to third parties, which is included in noninterest income.
(3) Represents changes in cash flows expected to be collected due to the impact of modifications, changes in prepayment assumptions and changes in interest rates on variable
rate PCI loans.
164