Wells Fargo 2012 Annual Report Download - page 210
Download and view the complete annual report
Please find page 210 of the 2012 Wells Fargo annual report below. You can navigate through the pages in the report by either clicking on the pages listed below, or by using the keyword search tool below to find specific information within the annual report.-
 1
1 -
2
-
3
-
4
-
5
-
6
-
7
-
8
-
9
-
10
-
11
-
12
-
13
-
14
-
15
-
16
-
17
-
18
-
19
-
20
-
21
-
22
-
23
-
24
-
25
-
26
-
27
-
28
-
29
-
30
-
31
-
32
-
33
-
34
-
35
-
36
-
37
-
38
-
39
-
40
-
41
-
42
-
43
-
44
-
45
-
46
-
47
-
48
-
49
-
50
-
51
-
52
-
53
-
54
-
55
-
56
-
57
-
58
-
59
-
60
-
61
-
62
-
63
-
64
-
65
-
66
-
67
-
68
-
69
-
70
-
71
-
72
-
73
-
74
-
75
-
76
-
77
-
78
-
79
-
80
-
81
-
82
-
83
-
84
-
85
-
86
-
87
-
88
-
89
-
90
-
91
-
92
-
93
-
94
-
95
-
96
-
97
-
98
-
99
-
100
-
101
-
102
-
103
-
104
-
105
-
106
-
107
-
108
-
109
-
110
-
111
-
112
-
113
-
114
-
115
-
116
-
117
-
118
-
119
-
120
-
121
-
122
-
123
-
124
-
125
-
126
-
127
-
128
-
129
-
130
-
131
-
132
-
133
-
134
-
135
-
136
-
137
-
138
-
139
-
140
-
141
-
142
-
143
-
144
-
145
-
146
-
147
-
148
-
149
-
150
-
151
-
152
-
153
-
154
-
155
-
156
-
157
-
158
-
159
-
160
-
161
-
162
-
163
-
164
-
165
-
166
-
167
-
168
-
169
-
170
-
171
-
172
-
173
-
174
-
175
-
176
-
177
-
178
-
179
-
180
-
181
-
182
-
183
-
184
-
185
-
186
-
187
-
188
-
189
-
190
-
191
-
192
-
193
-
194
-
195
-
196
-
197
-
198
-
199
-
 200
200 -
 201
201 -
 202
202 -
 203
203 -
 204
204 -
 205
205 -
 206
206 -
 207
207 -
 208
208 -
 209
209 -
 210
210 -
 211
211 -
 212
212 -
 213
213 -
 214
214 -
 215
215 -
 216
216 -
 217
217 -
 218
218 -
 219
219 -
 220
220 -
221
-
222
-
223
-
224
-
225
-
226
-
227
-
228
-
229
-
230
-
231
-
232
-
233
-
234
-
235
-
236
-
237
-
238
-
239
-
240
-
241
-
242
-
243
-
244
-
245
-
246
-
247
-
248
-
249
-
250
-
251
-
252
 |
 |

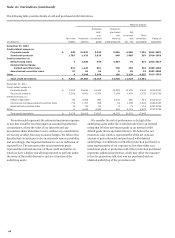
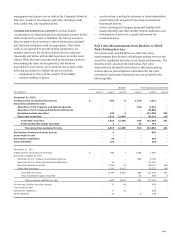
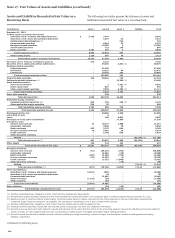
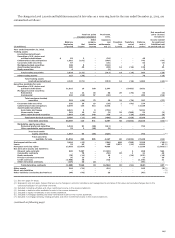
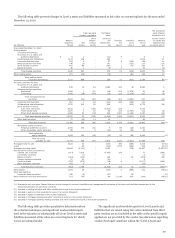
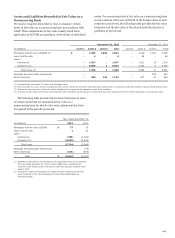
Note 17: Fair Values of Assets and Liabilities (continued)
(continued from previous page)
The following table presents gross purchases, sales, issuances and settlements related to the changes in Level 3 assets and liabilities
measured at fair value on a recurring basis for the year ended December 31, 2012.
(in millions) Purchases Sales Issuances Settlements Net
Year ended December 31, 2012
Trading assets
(excluding derivatives):
Securities of U.S. states and
political subdivisions $ 85 (95) - - (10)
Collateralized debt obligations 829 (1,478) - - (649)
Corporate debt securities 192 (237) - - (45)
Mortgage-backed securities 49 (159) - - (110)
Asset-backed securities 116 (169) - (45) (98)
Equity securities 1 (2) - - (1)
Total trading securities 1,272 (2,140) - (45) (913)
Other trading assets - - - - -
Total trading assets
(excluding derivatives) 1,272 (2,140) - (45)
(
913
)
Securities available for sale:
Securities of U.S. states and
political subdivisions 1,847 (37) 1,011 (1,474) 1,347
Mortgage-backed securities:
Residential 86 (34) - (2) 50
Commercial 39 - - (69) (30)
Total mortgage-backed
securities 125 (34) - (71) 20
Corporate debt securities 26 (37) - (9) (20)
Collateralized debt obligations 5,608 (185) - (1,483) 3,940
Asset-backed securities:
Auto loans and leases 3,004 - 666 (4,396) (726)
Home equity loans - (2) - (1) (3)
Other asset-backed securities 2,074 (159) 1,401 (2,987) 329
Total asset-backed securities 5,078 (161) 2,067 (7,384) (400)
Total debt securities 12,684 (454) 3,078 (10,421) 4,887
Marketable equity securities:
Perpetual preferred securities - - - (611) (611)
Other marketable equity securities - (8) - (1) (9)
Total marketable
equity securities - (8) - (612) (620)
Total securities
available for sale 12,684 (462) 3,078 (11,033) 4,267
Mortgages held for sale 441 - - (749)
(
308
)
Loans 2 - 257 (114) 145
Mortgage servicing rights - (293) 5,182 - 4,889
Net derivative assets and liabilities:
Interest rate contracts 11 - - (7,360)
(
7,349
)
Commodity contracts - (2) - (48) (50)
Equity contracts 386 (375) 1 6 18
Foreign exchange contracts 2 (3) - 6 5
Credit contracts (6) 3 - 813 810
Other derivative contracts - - - - -
Total derivative contracts 393 (377) 1 (6,583) (6,566)
Other assets 19 (8) - (72) (61)
Short sale liabilities 9 (9) - - -
Other liabilities (excluding derivatives) (3) 11 (216) 246 38
208