Wells Fargo 2012 Annual Report Download - page 58
Download and view the complete annual report
Please find page 58 of the 2012 Wells Fargo annual report below. You can navigate through the pages in the report by either clicking on the pages listed below, or by using the keyword search tool below to find specific information within the annual report.-
 1
1 -
2
-
3
-
4
-
5
-
6
-
7
-
8
-
9
-
10
-
11
-
12
-
13
-
14
-
15
-
16
-
17
-
18
-
19
-
20
-
21
-
22
-
23
-
24
-
25
-
26
-
27
-
28
-
29
-
30
-
31
-
32
-
33
-
34
-
35
-
36
-
37
-
38
-
39
-
40
-
41
-
42
-
43
-
44
-
45
-
46
-
47
-
 48
48 -
 49
49 -
 50
50 -
 51
51 -
 52
52 -
 53
53 -
 54
54 -
 55
55 -
 56
56 -
 57
57 -
 58
58 -
 59
59 -
 60
60 -
 61
61 -
 62
62 -
 63
63 -
 64
64 -
 65
65 -
 66
66 -
 67
67 -
 68
68 -
69
-
70
-
71
-
72
-
73
-
74
-
75
-
76
-
77
-
78
-
79
-
80
-
81
-
82
-
83
-
84
-
85
-
86
-
87
-
88
-
89
-
90
-
91
-
92
-
93
-
94
-
95
-
96
-
97
-
98
-
99
-
100
-
101
-
102
-
103
-
104
-
105
-
106
-
107
-
108
-
109
-
110
-
111
-
112
-
113
-
114
-
115
-
116
-
117
-
118
-
119
-
120
-
121
-
122
-
123
-
124
-
125
-
126
-
127
-
128
-
129
-
130
-
131
-
132
-
133
-
134
-
135
-
136
-
137
-
138
-
139
-
140
-
141
-
142
-
143
-
144
-
145
-
146
-
147
-
148
-
149
-
150
-
151
-
152
-
153
-
154
-
155
-
156
-
157
-
158
-
159
-
160
-
161
-
162
-
163
-
164
-
165
-
166
-
167
-
168
-
169
-
170
-
171
-
172
-
173
-
174
-
175
-
176
-
177
-
178
-
179
-
180
-
181
-
182
-
183
-
184
-
185
-
186
-
187
-
188
-
189
-
190
-
191
-
192
-
193
-
194
-
195
-
196
-
197
-
198
-
199
-
200
-
201
-
202
-
203
-
204
-
205
-
206
-
207
-
208
-
209
-
210
-
211
-
212
-
213
-
214
-
215
-
216
-
217
-
218
-
219
-
220
-
221
-
222
-
223
-
224
-
225
-
226
-
227
-
228
-
229
-
230
-
231
-
232
-
233
-
234
-
235
-
236
-
237
-
238
-
239
-
240
-
241
-
242
-
243
-
244
-
245
-
246
-
247
-
248
-
249
-
250
-
251
-
252
 |
 |

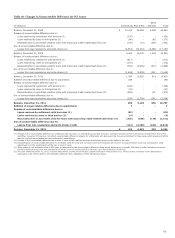
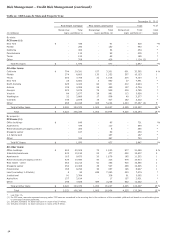
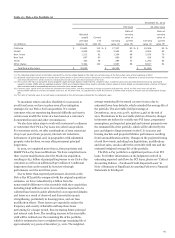
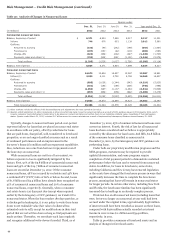
Risk Management – Credit Risk Management (continued)
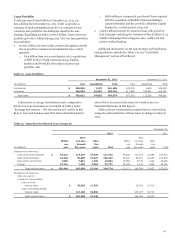
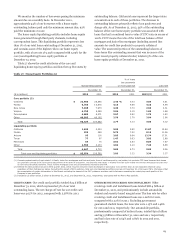
Table 21: CRE Loans by State and Property Type
December 31, 2012
Real estate mortgage Real estate construction Total % o
f
Nonaccrual Total Nonaccrual Total Nonaccrual Total total
(in millions) loans portfolio (1) loans portfolio (1) loans portfolio (1) loans
By state:
PCI loans (1):
New York $ - 438 - 91 - 529 *%
Florida - 290 - 150 - 440 *
California - 302 - 52 - 354 *
Pennsylvania - 112 - 93 - 205 *
Texas - 120 - 65 - 185 *
Other - 708 - 426 - 1,134 (2) *
Total PCI loans $ - 1,970 - 877 - 2,847 *%
All other loans:
California $ 794 29,291 157 3,301 951 32,592 4 %
Florida 374 8,800 133 1,353 507 10,153 1
Texas 283 7,708 32 1,416 315 9,124 1
New York 35 6,561 2 880 37 7,441 *
North Carolina 228 4,003 84 921 312 4,924 *
Arizona 129 4,265 28 489 157 4,754 *
Georgia 222 3,276 78 509 300 3,785 *
Virginia 84 2,677 28 981 112 3,658 *
Washington 32 2,869 17 508 49 3,377 *
Colorado 146 2,875 16 427 162 3,302 *
Other 995 32,045 428 5,242 1,423 37,287 (3) 5
Total all other loans $ 3,322 104,370 1,003 16,027 4,325 120,397 15 %
Total $ 3,322 106,340 1,003 16,904 4,325 123,244 15 %
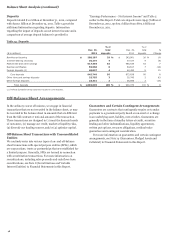
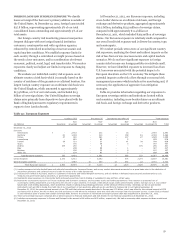
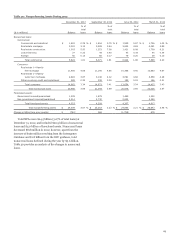
By property:
PCI loans (1):
Office buildings $ - 646 - 85 - 731 *%
Apartments - 474 - 120 - 594 *
Retail (excluding shopping center) - 360 - 5 - 365 *
Shopping center - 167 - 83 - 250 *
1-4 family land - - - 187 - 187 *
Other - 323 - 397 - 720 *
Total PCI loans $ - 1,970 - 877 - 2,847 *%
All other loans:
Office buildings $ 803 30,009 74 1,040 877 31,049 4 %
Industrial/warehouse 432 12,130 20 477 452 12,607 2
Apartments 165 9,873 20 1,679 185 11,552 1
Retail (excluding shopping center) 439 10,590 40 323 479 10,913 1
Real estate - other 363 10,212 52 353 415 10,565 1
Shopping center 353 10,008 35 537 388 10,545 1
Hotel/motel 166 8,250 30 687 196 8,937 1
Land (excluding 1-4 family) 5 94 248 7,380 253 7,474 *
Institutional 91 2,764 - 328 91 3,092 *
Agriculture 157 2,614 - 17 157 2,631 *
Other 348 7,826 484 3,206 832 11,032 1
Total all other loans $ 3,322 104,370 1,003 16,027 4,325 120,397 15 %
Total $ 3,322 106,340 1,003 16,904 4,325 123,244 15 %
* Less than 1%.
(1) For PCI loans, amounts represent carrying value. PCI loans are considered to be accruing due to the existence of the accretable yield and not based on consideration given
to contractual interest payments.
(2) Includes 32 states; no state had loans in excess of $157 million.
(3) Includes 40 states; no state had loans in excess of $2.9 billion.
56