Wells Fargo 2012 Annual Report Download - page 157
Download and view the complete annual report
Please find page 157 of the 2012 Wells Fargo annual report below. You can navigate through the pages in the report by either clicking on the pages listed below, or by using the keyword search tool below to find specific information within the annual report.-
 1
1 -
2
-
3
-
4
-
5
-
6
-
7
-
8
-
9
-
10
-
11
-
12
-
13
-
14
-
15
-
16
-
17
-
18
-
19
-
20
-
21
-
22
-
23
-
24
-
25
-
26
-
27
-
28
-
29
-
30
-
31
-
32
-
33
-
34
-
35
-
36
-
37
-
38
-
39
-
40
-
41
-
42
-
43
-
44
-
45
-
46
-
47
-
48
-
49
-
50
-
51
-
52
-
53
-
54
-
55
-
56
-
57
-
58
-
59
-
60
-
61
-
62
-
63
-
64
-
65
-
66
-
67
-
68
-
69
-
70
-
71
-
72
-
73
-
74
-
75
-
76
-
77
-
78
-
79
-
80
-
81
-
82
-
83
-
84
-
85
-
86
-
87
-
88
-
89
-
90
-
91
-
92
-
93
-
94
-
95
-
96
-
97
-
98
-
99
-
100
-
101
-
102
-
103
-
104
-
105
-
106
-
107
-
108
-
109
-
110
-
111
-
112
-
113
-
114
-
115
-
116
-
117
-
118
-
119
-
120
-
121
-
122
-
123
-
124
-
125
-
126
-
127
-
128
-
129
-
130
-
131
-
132
-
133
-
134
-
135
-
136
-
137
-
138
-
139
-
140
-
141
-
142
-
143
-
144
-
145
-
146
-
 147
147 -
 148
148 -
 149
149 -
 150
150 -
 151
151 -
 152
152 -
 153
153 -
 154
154 -
 155
155 -
 156
156 -
 157
157 -
 158
158 -
 159
159 -
 160
160 -
 161
161 -
 162
162 -
 163
163 -
 164
164 -
 165
165 -
 166
166 -
 167
167 -
168
-
169
-
170
-
171
-
172
-
173
-
174
-
175
-
176
-
177
-
178
-
179
-
180
-
181
-
182
-
183
-
184
-
185
-
186
-
187
-
188
-
189
-
190
-
191
-
192
-
193
-
194
-
195
-
196
-
197
-
198
-
199
-
200
-
201
-
202
-
203
-
204
-
205
-
206
-
207
-
208
-
209
-
210
-
211
-
212
-
213
-
214
-
215
-
216
-
217
-
218
-
219
-
220
-
221
-
222
-
223
-
224
-
225
-
226
-
227
-
228
-
229
-
230
-
231
-
232
-
233
-
234
-
235
-
236
-
237
-
238
-
239
-
240
-
241
-
242
-
243
-
244
-
245
-
246
-
247
-
248
-
249
-
250
-
251
-
252
 |
 |

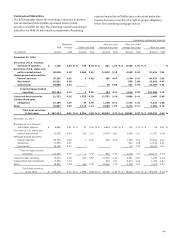
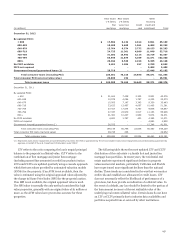
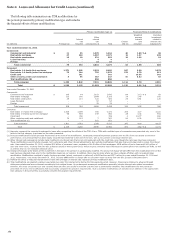
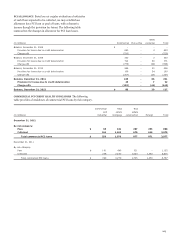
Commercial Real Real
and estate estate Lease
(in millions) industrial mortgage construction financing Foreign Total
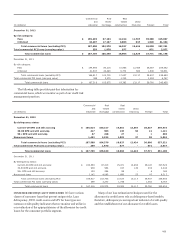
December 31, 2012
By risk category:
Pass $ 169,293 87,183 12,224 11,787 35,380 315,867
Criticized 18,207 17,187 3,803 637 1,520 41,354
Total commercial loans (excluding PCI) 187,500 104,370 16,027 12,424 36,900 357,221
Total commercial PCI loans (carrying value) 259 1,970 877 - 871 3,977
Total commercial loans $ 187,759 106,340 16,904 12,424 37,771 361,198
December 31, 2011
By risk category:
Pass $ 144,980 80,215 10,865 12,455 36,567 285,082
Criticized 21,837 22,490 6,772 662 1,840 53,601
Total commercial loans (excluding PCI) 166,817 102,705 17,637 13,117 38,407 338,683
Total commercial PCI loans (carrying value) 399 3,270 1,745 - 1,353 6,767
Total commercial loans $ 167,216 105,975 19,382 13,117 39,760 345,450
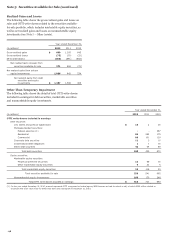
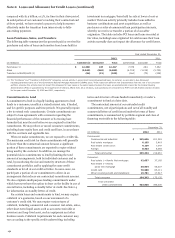
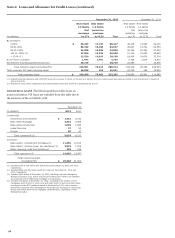
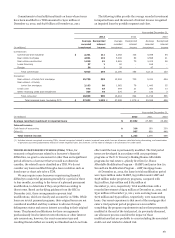
The following table provides past due information for
commercial loans, which we monitor as part of our credit risk
management practices.
Commercial Real Real
and estate estate Lease
(in millions) industrial mortgage construction financing Foreign Total
December 31, 2012
By delinquency status:
Current-29 DPD and still accruing $
185,614
100,317 14,861 12,344 36,837 349,973
30-89 DPD and still accruing 417 503 136 53 12 1,121
90+ DPD and still accruing 47 228 27 - 1 303
Nonaccrual loans 1,422 3,322 1,003 27 50 5,824
Total commercial loans (excluding PCI)
187,500
104,370 16,027 12,424 36,900 357,221
Total commercial PCI loans (carrying value) 259 1,970 877 - 871 3,977
Total commercial loans $
187,759
106,340 16,904 12,424 37,771 361,198
December 31, 2011
By delinquency status:
Current-29 DPD and still accruing $ 163,583 97,410 15,471 12,934 38,122 327,520
30-89 DPD and still accruing 939 954 187 130 232 2,442
90+ DPD and still accruing 153 256 89 - 6 504
Nonaccrual loans 2,142 4,085 1,890 53 47 8,217
Total commercial loans (excluding PCI) 166,817 102,705 17,637 13,117 38,407 338,683
Total commercial PCI loans (carrying value) 399 3,270 1,745 - 1,353 6,767
Total commercial loans $ 167,216 105,975 19,382 13,117 39,760 345,450
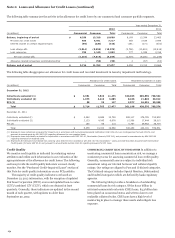
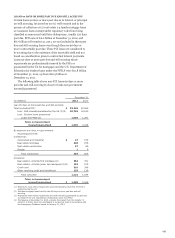
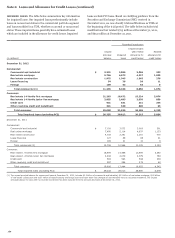
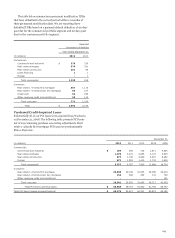
CONSUMER CREDIT QUALITY INDICATORS We have various
classes of consumer loans that present unique risks. Loan
delinquency, FICO credit scores and LTV for loan types are
common credit quality indicators that we monitor and utilize in
our evaluation of the appropriateness of the allowance for credit
losses for the consumer portfolio segment.
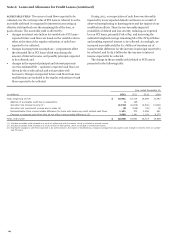
Many of our loss estimation techniques used for the
allowance for credit losses rely on delinquency-based models;
therefore, delinquency is an important indicator of credit quality
and the establishment of our allowance for credit losses.
155