Wells Fargo 2012 Annual Report Download - page 140
Download and view the complete annual report
Please find page 140 of the 2012 Wells Fargo annual report below. You can navigate through the pages in the report by either clicking on the pages listed below, or by using the keyword search tool below to find specific information within the annual report.-
 1
1 -
2
-
3
-
4
-
5
-
6
-
7
-
8
-
9
-
10
-
11
-
12
-
13
-
14
-
15
-
16
-
17
-
18
-
19
-
20
-
21
-
22
-
23
-
24
-
25
-
26
-
27
-
28
-
29
-
30
-
31
-
32
-
33
-
34
-
35
-
36
-
37
-
38
-
39
-
40
-
41
-
42
-
43
-
44
-
45
-
46
-
47
-
48
-
49
-
50
-
51
-
52
-
53
-
54
-
55
-
56
-
57
-
58
-
59
-
60
-
61
-
62
-
63
-
64
-
65
-
66
-
67
-
68
-
69
-
70
-
71
-
72
-
73
-
74
-
75
-
76
-
77
-
78
-
79
-
80
-
81
-
82
-
83
-
84
-
85
-
86
-
87
-
88
-
89
-
90
-
91
-
92
-
93
-
94
-
95
-
96
-
97
-
98
-
99
-
100
-
101
-
102
-
103
-
104
-
105
-
106
-
107
-
108
-
109
-
110
-
111
-
112
-
113
-
114
-
115
-
116
-
117
-
118
-
119
-
120
-
121
-
122
-
123
-
124
-
125
-
126
-
127
-
128
-
129
-
 130
130 -
 131
131 -
 132
132 -
 133
133 -
 134
134 -
 135
135 -
 136
136 -
 137
137 -
 138
138 -
 139
139 -
 140
140 -
 141
141 -
 142
142 -
 143
143 -
 144
144 -
 145
145 -
 146
146 -
 147
147 -
 148
148 -
 149
149 -
 150
150 -
151
-
152
-
153
-
154
-
155
-
156
-
157
-
158
-
159
-
160
-
161
-
162
-
163
-
164
-
165
-
166
-
167
-
168
-
169
-
170
-
171
-
172
-
173
-
174
-
175
-
176
-
177
-
178
-
179
-
180
-
181
-
182
-
183
-
184
-
185
-
186
-
187
-
188
-
189
-
190
-
191
-
192
-
193
-
194
-
195
-
196
-
197
-
198
-
199
-
200
-
201
-
202
-
203
-
204
-
205
-
206
-
207
-
208
-
209
-
210
-
211
-
212
-
213
-
214
-
215
-
216
-
217
-
218
-
219
-
220
-
221
-
222
-
223
-
224
-
225
-
226
-
227
-
228
-
229
-
230
-
231
-
232
-
233
-
234
-
235
-
236
-
237
-
238
-
239
-
240
-
241
-
242
-
243
-
244
-
245
-
246
-
247
-
248
-
249
-
250
-
251
-
252
 |
 |
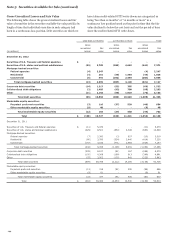
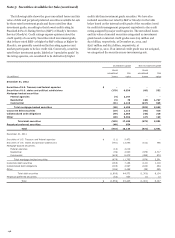
Note 1: Summary of Significant Accounting Policies (continued)
equivalents (for example, stock options, restricted share rights,
convertible debentures and warrants) that are dilutive.
Fair Value of Financial Instruments
We use fair value measurements in our fair value disclosures and
to record certain assets and liabilities at fair value on a recurring
basis, such as trading assets, or on a nonrecurring basis such as
measuring impairment on assets carried at amortized cost.
DETERMINATION OF FAIR VALUE We base our fair values on
the price that would be received to sell an asset or paid to
transfer a liability in an orderly transaction between market
participants at the measurement date. These fair value
measurements are based on exit prices and determined by
maximizing the use of observable inputs. However, for certain
instruments we must utilize unobservable inputs in determining
fair value due to the lack of observable inputs in the market
which requires greater judgment in measuring fair value.
In instances where there is limited or no observable market
data, fair value measurements for assets and liabilities are based
primarily upon our own estimates or combination of our own
estimates and third-party vendor or broker pricing, and the
measurements are often calculated based on current pricing for
products we offer or issue, the economic and competitive
environment, the characteristics of the asset or liability and
other such factors. As with any valuation technique used to
estimate fair value, changes in underlying assumptions used,
including discount rates and estimates of future cash flows,
could significantly affect the results of current or future values.
Accordingly, these fair value estimates may not be realized in an
actual sale or immediate settlement of the asset or liability.
We incorporate lack of liquidity into our fair value
measurement based on the type of asset or liability measured
and the valuation methodology used. For example, for certain
residential MHFS and certain securities where the significant
inputs have become unobservable due to illiquid markets and
vendor or broker pricing is not used, we use a discounted cash
flow technique to measure fair value. This technique
incorporates forecasting of expected cash flows (adjusted for
credit loss assumptions and estimated prepayment speeds)
discounted at an appropriate market discount rate to reflect the
lack of liquidity in the market that a market participant would
consider. For other securities where vendor or broker pricing is
used, we use either unadjusted broker quotes or vendor prices or
vendor or broker prices adjusted by weighting them with
internal discounted cash flow techniques to measure fair value.
These unadjusted vendor or broker prices inherently reflect any
lack of liquidity in the market as the fair value measurement
represents an exit price from a market participant viewpoint.
Where markets are inactive and transactions are not orderly,
transaction or quoted prices for assets or liabilities in inactive
markets may require adjustment due to the uncertainty of
whether the underlying transactions are orderly. For items that
use price quotes in inactive markets, such as certain security
classes within securities available for sale, we analyze the degree
of market inactivity and distressed transactions to determine the
appropriate adjustment to the price quotes.
The methodology used to adjust the quotes involves
weighting the price quotes and results of internal pricing
techniques such as the net present value of future expected cash
flows (with observable inputs, where available) discounted at a
rate of return market participants require. The significant inputs
utilized in the internal pricing techniques, which are estimated
by type of underlying collateral, include credit loss assumptions,
estimated prepayment speeds and discount rates.
The more active and orderly markets for particular security
classes are determined to be, the more weighting is assigned to
price quotes. The less active and orderly markets are determined
to be, the less weighting is assigned to price quotes. We
continually assess the level and volume of market activity in our
investment security classes in determining adjustments, if any,
to price quotes. Given market conditions can change over time,
our determination of which securities markets are considered
active or inactive can change. If we determine a market to be
inactive, the degree to which price quotes require adjustment,
can also change. See Note 17 for further discussion of the
valuation methodologies applied to financial instruments to
determine fair value.
FAIR VALUE HIERARCHY We group our assets and liabilities
measured at fair value in three levels, based on the markets in
which the assets and liabilities are traded and the reliability of
the assumptions used to determine fair value. These levels are:
x Level 1 – Valuation is based upon quoted prices for identical
instruments traded in active markets.
x Level 2 – Valuation is based upon quoted prices for similar
instruments in active markets, quoted prices for identical or
similar instruments in markets that are not active, and
model-based valuation techniques for which all significant
assumptions are observable in the market.
x Level 3 – Valuation is generated from techniques that use
significant assumptions not observable in the market. These
unobservable assumptions reflect estimates of assumptions
that market participants would use in pricing the asset or
liability. Valuation techniques include use of option pricing
models, discounted cash flow models and similar
techniques.
In the determination of the classification of financial
instruments in Level 2 or Level 3 of the fair value hierarchy, we
consider all available information, including observable market
data, indications of market liquidity and orderliness, and our
understanding of the valuation techniques and significant inputs
used. For securities in inactive markets, we use a predetermined
percentage to evaluate the impact of fair value adjustments
derived from weighting both external and internal indications of
value to determine if the instrument is classified as Level 2 or
Level 3. Based upon the specific facts and circumstances of each
instrument or instrument category, we make judgments
regarding the significance of the Level 3 inputs to the
instruments' fair value measurement in its entirety. If Level 3
inputs are considered significant, the instrument is classified as
Level 3.
Derivatives and Hedging Activities
We recognize all derivatives in the balance sheet at fair value. On
the date we enter into a derivative contract, we designate the
derivative as (1) a hedge of the fair value of a recognized asset or
138