Wells Fargo 2012 Annual Report Download - page 215
Download and view the complete annual report
Please find page 215 of the 2012 Wells Fargo annual report below. You can navigate through the pages in the report by either clicking on the pages listed below, or by using the keyword search tool below to find specific information within the annual report.-
 1
1 -
2
-
3
-
4
-
5
-
6
-
7
-
8
-
9
-
10
-
11
-
12
-
13
-
14
-
15
-
16
-
17
-
18
-
19
-
20
-
21
-
22
-
23
-
24
-
25
-
26
-
27
-
28
-
29
-
30
-
31
-
32
-
33
-
34
-
35
-
36
-
37
-
38
-
39
-
40
-
41
-
42
-
43
-
44
-
45
-
46
-
47
-
48
-
49
-
50
-
51
-
52
-
53
-
54
-
55
-
56
-
57
-
58
-
59
-
60
-
61
-
62
-
63
-
64
-
65
-
66
-
67
-
68
-
69
-
70
-
71
-
72
-
73
-
74
-
75
-
76
-
77
-
78
-
79
-
80
-
81
-
82
-
83
-
84
-
85
-
86
-
87
-
88
-
89
-
90
-
91
-
92
-
93
-
94
-
95
-
96
-
97
-
98
-
99
-
100
-
101
-
102
-
103
-
104
-
105
-
106
-
107
-
108
-
109
-
110
-
111
-
112
-
113
-
114
-
115
-
116
-
117
-
118
-
119
-
120
-
121
-
122
-
123
-
124
-
125
-
126
-
127
-
128
-
129
-
130
-
131
-
132
-
133
-
134
-
135
-
136
-
137
-
138
-
139
-
140
-
141
-
142
-
143
-
144
-
145
-
146
-
147
-
148
-
149
-
150
-
151
-
152
-
153
-
154
-
155
-
156
-
157
-
158
-
159
-
160
-
161
-
162
-
163
-
164
-
165
-
166
-
167
-
168
-
169
-
170
-
171
-
172
-
173
-
174
-
175
-
176
-
177
-
178
-
179
-
180
-
181
-
182
-
183
-
184
-
185
-
186
-
187
-
188
-
189
-
190
-
191
-
192
-
193
-
194
-
195
-
196
-
197
-
198
-
199
-
200
-
201
-
202
-
203
-
204
-
 205
205 -
 206
206 -
 207
207 -
 208
208 -
 209
209 -
 210
210 -
 211
211 -
 212
212 -
 213
213 -
 214
214 -
 215
215 -
 216
216 -
 217
217 -
 218
218 -
 219
219 -
 220
220 -
 221
221 -
 222
222 -
 223
223 -
 224
224 -
 225
225 -
226
-
227
-
228
-
229
-
230
-
231
-
232
-
233
-
234
-
235
-
236
-
237
-
238
-
239
-
240
-
241
-
242
-
243
-
244
-
245
-
246
-
247
-
248
-
249
-
250
-
251
-
252
 |
 |

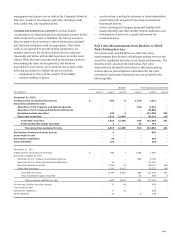
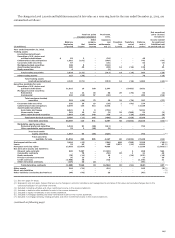
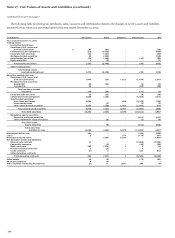
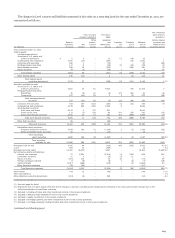
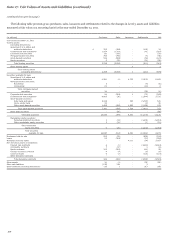
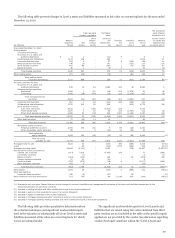
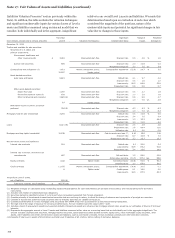
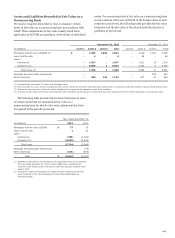
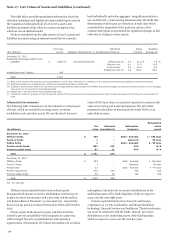
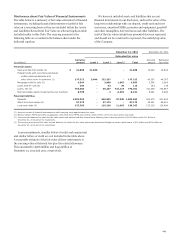
The valuation techniques used for our Level 3 assets and
liabilities, as presented in the previous table, are described as
follows:
x Discounted cash flow - Discounted cash flow valuation
techniques generally consist of developing an estimate of
future cash flows that are expected to occur over the life of
an instrument and then discounting those cash flows at a
rate of return that results in the fair value amount.
x Option model - Option model valuation techniques are
generally used for instruments in which the holder has a
contingent right or obligation based on the occurrence of a
future event, such as the price of a referenced asset going
above or below a predetermined strike price. Option models
estimate the likelihood of the specified event occurring by
incorporating assumptions such as volatility estimates, price
of the underlying instrument and expected rate of return.
x Market comparable pricing - Market comparable pricing
valuation techniques are used to determine the fair value of
certain instruments by incorporating known inputs such as
recent transaction prices, pending transactions, or prices of
other similar investments which require significant
adjustment to reflect differences in instrument
characteristics.
x Vendor-priced – Prices obtained from third party pricing
vendors or brokers that are used to record the fair value of
the asset or liability, of which the related valuation
technique and significant unobservable inputs are not
provided.
Significant unobservable inputs presented in the previous
table are those we consider significant to the fair value of the
Level 3 asset or liability. We consider unobservable inputs to be
significant, if by their exclusion, the fair value of the Level 3 asset
or liability would be impacted by a predetermined percentage
change or based on qualitative factors such as nature of the
instrument, type of valuation technique used, and the
significance of the unobservable inputs relative to other inputs
used within the valuation. Following is a description of the
significant unobservable inputs provided in the table.
x Comparability adjustment – is an adjustment made to
observed market data such as a transaction price in order to
reflect dissimilarities in underlying collateral, issuer, rating,
or other factors used within a market valuation approach,
expressed as a percentage of an observed price.
x Correlation factor - is the likelihood of one instrument
changing in price relative to another based on an
established relationship expressed as a percentage of
relative change in price over a period over time.
x Cost to service - is the expected cost per loan of servicing a
portfolio of loans which includes estimates for
unreimbursed expenses (including delinquency and
foreclosure costs) that may occur as a result of servicing
such loan portfolios.
x Credit spread – is the portion of the interest rate in excess of
a benchmark interest rate, such as LIBOR or U.S. Treasury
rates, that when applied to an investment captures changes
in the obligor’s creditworthiness.
x Default rate – is an estimate of the likelihood of not
collecting contractual amounts owed expressed as a
constant default rate (CDR).
x Discount rate – is a rate of return used to present value the
future expected cash flow to arrive at the fair value of an
instrument. The discount rate consists of a benchmark rate
component and a risk premium component. The benchmark
rate component, for example, LIBOR or U.S. Treasury rates,
is generally observable within the market and is necessary to
appropriately reflect the time value of money. The risk
premium component reflects the amount of compensation
market participants require due to the uncertainty inherent
in the instruments’ cash flows resulting from risks such as
credit and liquidity.
x Fall-out factor - is the expected percentage of loans
associated with our interest rate lock commitment portfolio
that are likely of not funding.
x Initial-value servicing - is the estimated value of the
underlying loan, including the value attributable to the
embedded servicing right, expressed in basis points of
outstanding unpaid principal balance.
x Loss severity – is the percentage of contractual cash flows
lost in the event of a default.
x Prepayment rate – is the estimated rate at which forecasted
prepayments of principal of the related loan or debt
instrument are expected to occur, expressed as a constant
prepayment rate (CPR).
x Utilization rate – is the estimated rate in which incremental
portions of existing reverse mortgage credit lines are
expected to be drawn by borrowers, expressed as an
annualized rate.
x Volatility factor – is the extent of change in price an item is
estimated to fluctuate over a specified period of time
expressed as a percentage of relative change in price over a
period over time.
x Weighted average life – is the weighted average number of
years an investment is expected to remain outstanding,
based on its expected cash flows reflecting the estimated
date the issuer will call or extend the maturity of the
instrument or otherwise reflecting an estimate of the timing
of an instrument’s cash flows whose timing is not
contractually fixed.
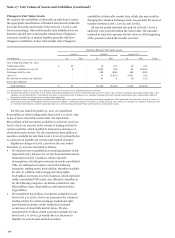
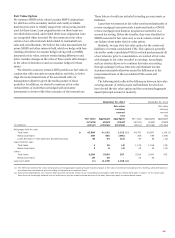
Significant Recurring Level 3 Fair Value Asset and
Liability Input Sensitivity
We generally use discounted cash flow or similar internal
modeling techniques to determine the fair value of our Level 3
assets and liabilities. Use of these techniques requires
determination of relevant inputs and assumptions, some of
which represent significant unobservable inputs as indicated in
the preceding table. Accordingly, changes in these unobservable
inputs may have a significant impact on fair value.
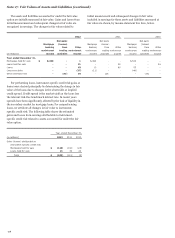
Certain of these unobservable inputs will (in isolation) have a
directionally consistent impact on the fair value of the
instrument for a given change in that input. Alternatively, the
fair value of the instrument may move in an opposite direction
for a given change in another input. Where multiple inputs are
used within the valuation technique of an asset or liability, a
213