Wells Fargo 2012 Annual Report Download - page 70
Download and view the complete annual report
Please find page 70 of the 2012 Wells Fargo annual report below. You can navigate through the pages in the report by either clicking on the pages listed below, or by using the keyword search tool below to find specific information within the annual report.-
 1
1 -
2
-
3
-
4
-
5
-
6
-
7
-
8
-
9
-
10
-
11
-
12
-
13
-
14
-
15
-
16
-
17
-
18
-
19
-
20
-
21
-
22
-
23
-
24
-
25
-
26
-
27
-
28
-
29
-
30
-
31
-
32
-
33
-
34
-
35
-
36
-
37
-
38
-
39
-
40
-
41
-
42
-
43
-
44
-
45
-
46
-
47
-
48
-
49
-
50
-
51
-
52
-
53
-
54
-
55
-
56
-
57
-
58
-
59
-
 60
60 -
 61
61 -
 62
62 -
 63
63 -
 64
64 -
 65
65 -
 66
66 -
 67
67 -
 68
68 -
 69
69 -
 70
70 -
 71
71 -
 72
72 -
 73
73 -
 74
74 -
 75
75 -
 76
76 -
 77
77 -
 78
78 -
 79
79 -
 80
80 -
81
-
82
-
83
-
84
-
85
-
86
-
87
-
88
-
89
-
90
-
91
-
92
-
93
-
94
-
95
-
96
-
97
-
98
-
99
-
100
-
101
-
102
-
103
-
104
-
105
-
106
-
107
-
108
-
109
-
110
-
111
-
112
-
113
-
114
-
115
-
116
-
117
-
118
-
119
-
120
-
121
-
122
-
123
-
124
-
125
-
126
-
127
-
128
-
129
-
130
-
131
-
132
-
133
-
134
-
135
-
136
-
137
-
138
-
139
-
140
-
141
-
142
-
143
-
144
-
145
-
146
-
147
-
148
-
149
-
150
-
151
-
152
-
153
-
154
-
155
-
156
-
157
-
158
-
159
-
160
-
161
-
162
-
163
-
164
-
165
-
166
-
167
-
168
-
169
-
170
-
171
-
172
-
173
-
174
-
175
-
176
-
177
-
178
-
179
-
180
-
181
-
182
-
183
-
184
-
185
-
186
-
187
-
188
-
189
-
190
-
191
-
192
-
193
-
194
-
195
-
196
-
197
-
198
-
199
-
200
-
201
-
202
-
203
-
204
-
205
-
206
-
207
-
208
-
209
-
210
-
211
-
212
-
213
-
214
-
215
-
216
-
217
-
218
-
219
-
220
-
221
-
222
-
223
-
224
-
225
-
226
-
227
-
228
-
229
-
230
-
231
-
232
-
233
-
234
-
235
-
236
-
237
-
238
-
239
-
240
-
241
-
242
-
243
-
244
-
245
-
246
-
247
-
248
-
249
-
250
-
251
-
252
 |
 |

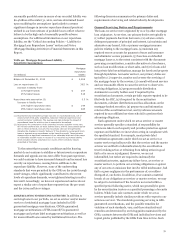
Risk Management – Credit Risk Management (continued)
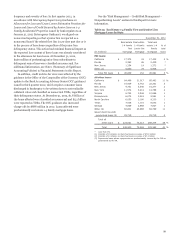
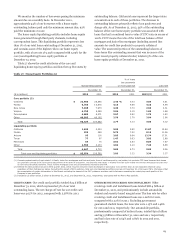
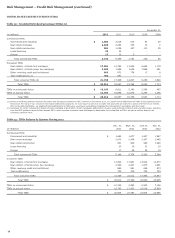
TROUBLED DEBT RESTRUCTURINGS (TDRs)
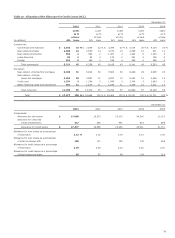
Table 32: Troubled Debt Restructurings (TDRs) (1)
December 31,
(in millions) 2012 2011 2010 2009 2008
Commercial TDRs
Commercial and industrial $ 1,683 2,026 613 82 28
Real estate mortgage 2,625 2,262 725 73 2
Real estate construction 801 1,008 407 110 35
Lease financing 20 33 - - -
Foreign 17 20 6 - -
Total commercial TDRs 5,146 5,349 1,751 265 65
Consumer TDRs
Real estate 1-4 family first mortgage 17,804 13,799 11,603 6,685 1,179
Real estate 1-4 family junior lien mortgage 2,390 1,986 1,626 1,566 461
Other revolving credit and installment 869 872 778 17 8
Trial modifications (1) 705 651 - - -
Total consumer TDRs (2) 21,768 17,308 14,007 8,268 1,648
Total TDRs $ 26,914 22,657 15,758 8,533 1,713
TDRs on nonaccrual status $ 10,149 6,811 5,185 2,289 467
TDRs on accrual status 16,765 15,846 10,573 6,244 1,246
Total TDRs $ 26,914 22,657 15,758 8,533 1,713
(1) Based on clarifying guidance from the Securities and Exchange Commission (SEC) received in December 2011, we classify trial modifications as TDRs at the beginning of the
trial period. For many of our consumer real estate modification programs, we may require a borrower to make trial payments generally for a period of three to four months.
Prior to the SEC clarification, we classified trial modifications as TDRs once a borrower successfully completed the trial period in accordance with the terms.
(2) December 31, 2012, includes $5.2 billion of loans, consisting of $4.5 billion of first mortgages, $506 million of junior liens and $140 million of auto and other loans, resulting
from the OCC guidance issued in third quarter 2012, which requires consumer loans discharged in bankruptcy to be classified as TDRs, as well as written down to net
realizable collateral value.
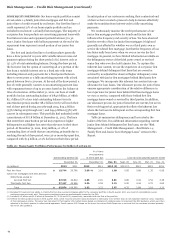
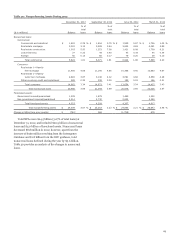
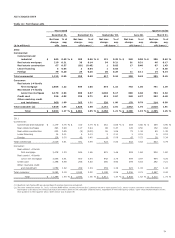
Table 33: TDRs Balance by Quarter During 2012
Dec. 31, Sept. 30, June 30, Mar. 31,
(in millions) 2012 2012 2012 2012
Commercial TDRs
Commercial and industrial $ 1,683 1,877 1,937 1,967
Real estate mortgage 2,625 2,498 2,457 2,485
Real estate construction 801 949 980 1,048
Lease financing 20 26 27 29
Foreign 17 28 28 19
Total commercial TDRs 5,146 5,378 5,429 5,548
Consumer TDRs
Real estate 1-4 family first mortgage 17,804 17,861 13,919 13,870
Real estate 1-4 family junior lien mortgage 2,390 2,437 1,975 1,981
Other revolving credit and installment 869 981 856 873
Trial modifications 705 733 745 723
Total consumer TDRs 21,768 22,012 17,495 17,447
Total TDRs $ 26,914 27,390 22,924 22,995
TDRs on nonaccrual status $ 10,149 9,990 6,900 7,136
TDRs on accrual status 16,765 17,400 16,024 15,859
Total TDRs $ 26,914 27,390 22,924 22,995
68