Wells Fargo 2012 Annual Report Download - page 139
Download and view the complete annual report
Please find page 139 of the 2012 Wells Fargo annual report below. You can navigate through the pages in the report by either clicking on the pages listed below, or by using the keyword search tool below to find specific information within the annual report.-
 1
1 -
2
-
3
-
4
-
5
-
6
-
7
-
8
-
9
-
10
-
11
-
12
-
13
-
14
-
15
-
16
-
17
-
18
-
19
-
20
-
21
-
22
-
23
-
24
-
25
-
26
-
27
-
28
-
29
-
30
-
31
-
32
-
33
-
34
-
35
-
36
-
37
-
38
-
39
-
40
-
41
-
42
-
43
-
44
-
45
-
46
-
47
-
48
-
49
-
50
-
51
-
52
-
53
-
54
-
55
-
56
-
57
-
58
-
59
-
60
-
61
-
62
-
63
-
64
-
65
-
66
-
67
-
68
-
69
-
70
-
71
-
72
-
73
-
74
-
75
-
76
-
77
-
78
-
79
-
80
-
81
-
82
-
83
-
84
-
85
-
86
-
87
-
88
-
89
-
90
-
91
-
92
-
93
-
94
-
95
-
96
-
97
-
98
-
99
-
100
-
101
-
102
-
103
-
104
-
105
-
106
-
107
-
108
-
109
-
110
-
111
-
112
-
113
-
114
-
115
-
116
-
117
-
118
-
119
-
120
-
121
-
122
-
123
-
124
-
125
-
126
-
127
-
128
-
 129
129 -
 130
130 -
 131
131 -
 132
132 -
 133
133 -
 134
134 -
 135
135 -
 136
136 -
 137
137 -
 138
138 -
 139
139 -
 140
140 -
 141
141 -
 142
142 -
 143
143 -
 144
144 -
 145
145 -
 146
146 -
 147
147 -
 148
148 -
 149
149 -
150
-
151
-
152
-
153
-
154
-
155
-
156
-
157
-
158
-
159
-
160
-
161
-
162
-
163
-
164
-
165
-
166
-
167
-
168
-
169
-
170
-
171
-
172
-
173
-
174
-
175
-
176
-
177
-
178
-
179
-
180
-
181
-
182
-
183
-
184
-
185
-
186
-
187
-
188
-
189
-
190
-
191
-
192
-
193
-
194
-
195
-
196
-
197
-
198
-
199
-
200
-
201
-
202
-
203
-
204
-
205
-
206
-
207
-
208
-
209
-
210
-
211
-
212
-
213
-
214
-
215
-
216
-
217
-
218
-
219
-
220
-
221
-
222
-
223
-
224
-
225
-
226
-
227
-
228
-
229
-
230
-
231
-
232
-
233
-
234
-
235
-
236
-
237
-
238
-
239
-
240
-
241
-
242
-
243
-
244
-
245
-
246
-
247
-
248
-
249
-
250
-
251
-
252
 |
 |
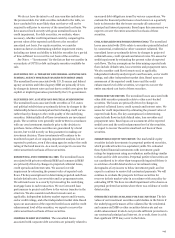
correspondent and other third party originators, and projected
loss severity. We establish a liability at the time loans are sold
and continually update our liability estimate during their life.
Although activity can vary by investor, investors may demand
repurchase at any time and there is often a lag from the date of
default to the time we receive a repurchase demand. This lag has
lengthened as some investor audit reviews, particularly by the
GSEs, have changed to reopen or expand reviews on previously
defaulted populations. Accordingly, the majority of repurchase
demands continue to be on loans that default in the first 24 to 36
months following origination of the mortgage loan.
The liability for mortgage loan repurchase losses is included
in other liabilities. For additional information on our repurchase
liability, see Note 9.
Pension Accounting
We account for our defined benefit pension plans using an
actuarial model. Two principal assumptions in determining net
periodic pension cost are the discount rate and the expected long
term rate of return on plan assets.
A discount rate is used to estimate the present value of our
future pension benefit obligations. We use a consistent
methodology to determine the discount rate that is based on an
established yield curve methodology. This methodology
incorporates a broad group of top quartile Aa bonds consisting of
approximately 325-350 bonds. The discount rate is determined
by matching this yield curve with the timing and amounts of the
expected benefit payments for our plans.
Our determination of the reasonableness of our expected
long-term rate of return on plan assets is highly quantitative by
nature. We evaluate the current asset allocations and expected
returns under two sets of conditions: projected returns using
several forward-looking capital market assumptions, and
historical returns for the main asset classes dating back to 1970
or the earliest period for which historical data was readily
available for the asset classes included. Using long term
historical data allows us to capture multiple economic
environments, which we believe is relevant when using historical
returns. We place greater emphasis on the forward-looking
return and risk assumptions than on historical results. We use
the resulting projections to derive a base line expected rate of
return and risk level for the Cash Balance Plans' prescribed asset
mix. We evaluate the portfolio based on: (1) the established
target asset allocations over short term (one-year) and longer
term (ten-year) investment horizons, and (2) the range of
potential outcomes over these horizons within specific standard
deviations. We perform the above analyses to assess the
reasonableness of our expected long-term rate of return on plan
assets. We consider the expected rate of return to be a long-term
average view of expected returns. The use of an expected long
term rate of return on plan assets may cause us to recognize
pension income returns that are greater or less than the actual
returns of plan assets in any given year. Differences between
expected and actual returns in each year, if any, are included in
our net actuarial gain or loss amount, which is recognized in
OCI. We generally amortize net actuarial gain or loss in excess of
a 5% corridor from accumulated OCI into net periodic pension
cost over the estimated average remaining participation period,
which at December 31, 2012, is 16 years. See Note 20 for
additional information on our pension accounting.
Income Taxes
We file consolidated and separate company federal income tax
returns, foreign tax returns and various combined and separate
company state tax returns.
We evaluate two components of income tax expense: current
and deferred. Current income tax expense represents our
estimated taxes to be paid or refunded for the current period and
includes income tax expense related to our uncertain tax
positions. We determine deferred income taxes using the
balance sheet method. Under this method, the net deferred tax
asset or liability is based on the tax effects of the differences
between the book and tax bases of assets and liabilities, and
recognizes enacted changes in tax rates and laws in the period in
which they occur. Deferred income tax expense results from
changes in deferred tax assets and liabilities between periods.
Deferred tax assets are recognized subject to management's
judgment that realization is “more likely than not.” Uncertain tax
positions that meet the more likely than not recognition
threshold are measured to determine the amount of benefit to
recognize. An uncertain tax position is measured at the largest
amount of benefit that management believes has a greater than
50% likelihood of realization upon settlement. Tax benefits not
meeting our realization criteria represent unrecognized tax
benefits. Foreign taxes paid are generally applied as credits to
reduce federal income taxes payable. We account for interest and
penalties as a component of income tax expense.
Stock-Based Compensation
We have stock-based employee compensation plans as more
fully discussed in Note 19. Our Long-Term Incentive
Compensation Plan provides for awards of incentive and
nonqualified stock options, stock appreciation rights, restricted
shares, RSRs, performance share awards and stock awards
without restrictions. We measure the cost of employee services
received in exchange for an award of equity instruments, such as
stock options, restricted share rights (RSRs) or performance
shares, based on the fair value of the award on the grant date.
The cost is normally recognized in our income statement over
the vesting period of the award; awards with graded vesting are
expensed on a straight line method. Awards that continue to vest
after retirement are expensed over the shorter of the period of
time between the grant date and the final vesting period or
between the grant date and when a team member becomes
retirement eligible; awards to team members who are retirement
eligible at the grant date are subject to immediate expensing
upon grant.
Earnings Per Common Share
We compute earnings per common share by dividing net income
(after deducting dividends on preferred stock) by the average
number of common shares outstanding during the year. We
compute diluted earnings per common share by dividing net
income (after deducting dividends and related accretion on
preferred stock) by the average number of common shares
outstanding during the year, plus the effect of common stock
137