Wells Fargo 2012 Annual Report Download - page 41
Download and view the complete annual report
Please find page 41 of the 2012 Wells Fargo annual report below. You can navigate through the pages in the report by either clicking on the pages listed below, or by using the keyword search tool below to find specific information within the annual report.-
 1
1 -
2
-
3
-
4
-
5
-
6
-
7
-
8
-
9
-
10
-
11
-
12
-
13
-
14
-
15
-
16
-
17
-
18
-
19
-
20
-
21
-
22
-
23
-
24
-
25
-
26
-
27
-
28
-
29
-
30
-
 31
31 -
 32
32 -
 33
33 -
 34
34 -
 35
35 -
 36
36 -
 37
37 -
 38
38 -
 39
39 -
 40
40 -
 41
41 -
 42
42 -
 43
43 -
 44
44 -
 45
45 -
 46
46 -
 47
47 -
 48
48 -
 49
49 -
 50
50 -
 51
51 -
52
-
53
-
54
-
55
-
56
-
57
-
58
-
59
-
60
-
61
-
62
-
63
-
64
-
65
-
66
-
67
-
68
-
69
-
70
-
71
-
72
-
73
-
74
-
75
-
76
-
77
-
78
-
79
-
80
-
81
-
82
-
83
-
84
-
85
-
86
-
87
-
88
-
89
-
90
-
91
-
92
-
93
-
94
-
95
-
96
-
97
-
98
-
99
-
100
-
101
-
102
-
103
-
104
-
105
-
106
-
107
-
108
-
109
-
110
-
111
-
112
-
113
-
114
-
115
-
116
-
117
-
118
-
119
-
120
-
121
-
122
-
123
-
124
-
125
-
126
-
127
-
128
-
129
-
130
-
131
-
132
-
133
-
134
-
135
-
136
-
137
-
138
-
139
-
140
-
141
-
142
-
143
-
144
-
145
-
146
-
147
-
148
-
149
-
150
-
151
-
152
-
153
-
154
-
155
-
156
-
157
-
158
-
159
-
160
-
161
-
162
-
163
-
164
-
165
-
166
-
167
-
168
-
169
-
170
-
171
-
172
-
173
-
174
-
175
-
176
-
177
-
178
-
179
-
180
-
181
-
182
-
183
-
184
-
185
-
186
-
187
-
188
-
189
-
190
-
191
-
192
-
193
-
194
-
195
-
196
-
197
-
198
-
199
-
200
-
201
-
202
-
203
-
204
-
205
-
206
-
207
-
208
-
209
-
210
-
211
-
212
-
213
-
214
-
215
-
216
-
217
-
218
-
219
-
220
-
221
-
222
-
223
-
224
-
225
-
226
-
227
-
228
-
229
-
230
-
231
-
232
-
233
-
234
-
235
-
236
-
237
-
238
-
239
-
240
-
241
-
242
-
243
-
244
-
245
-
246
-
247
-
248
-
249
-
250
-
251
-
252
 |
 |
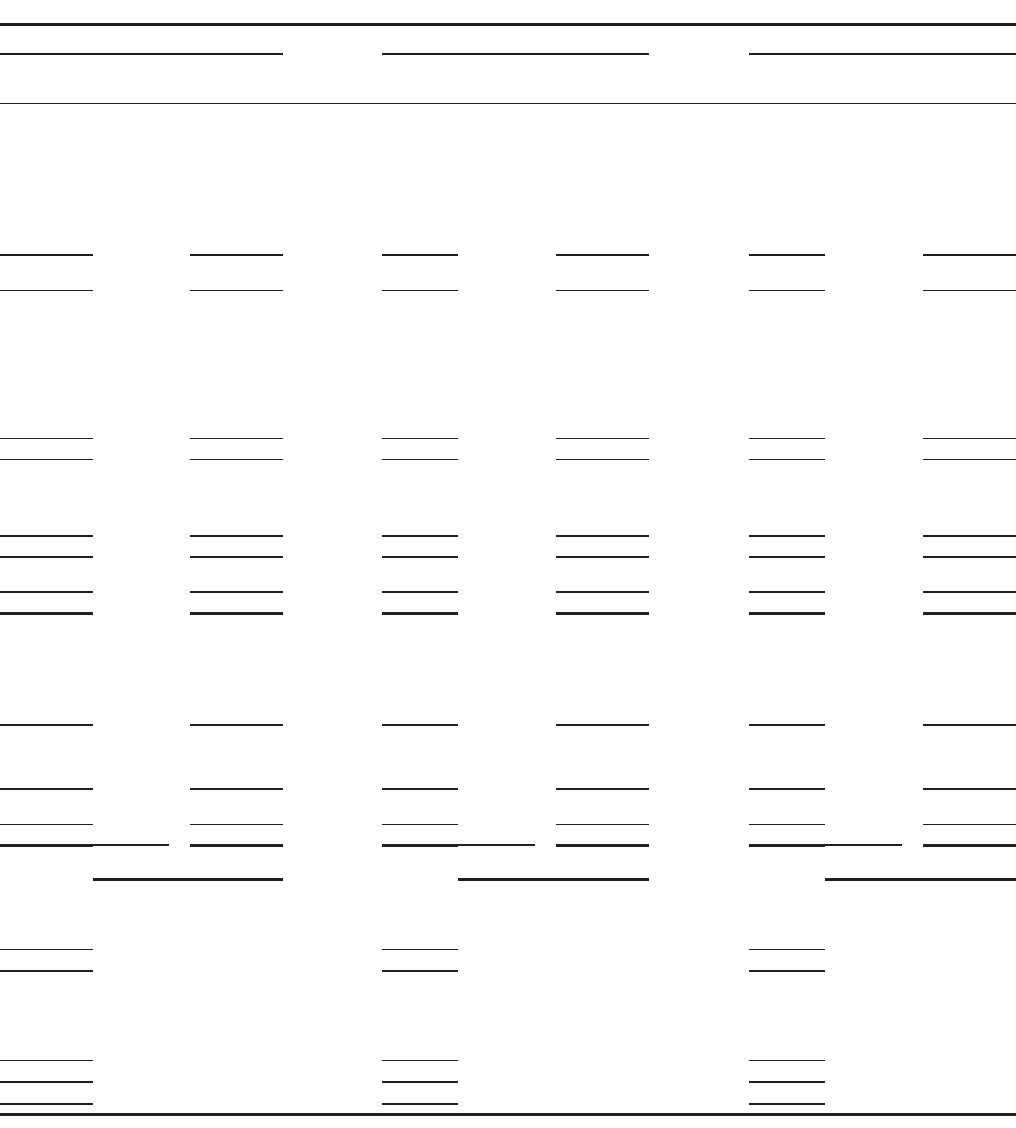
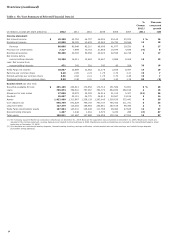
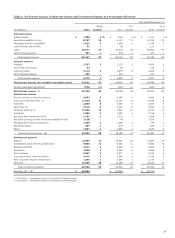
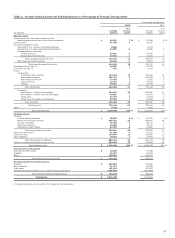
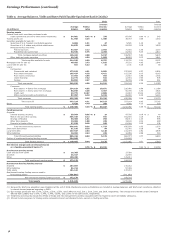
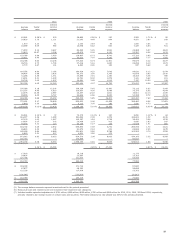
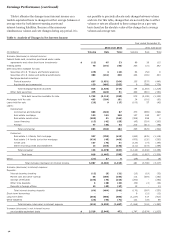
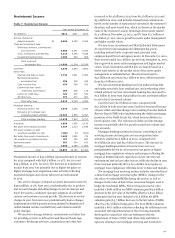
2010 2009 2008
Interes
t
Interest Interest
Average Yields/ income/ Average Yields/ income/ Average Yields/ income/
balance rates expense balance rates expense balance rates expense
$ 62,961 0.36 % $ 230 26,869 0.56 % $ 150 5,293 1.71 % $ 90
29,920 3.75 1,121 21,092 4.48 944 4,971 3.80 189
1,870 3.24 61 2,436 2.83 69 1,065 3.84 41
16,089 6.09 980 13,098 6.42 840 7,329 6.83 501
71,953 5.14 3,697 84,295 5.45 4,591 43,968 5.97 2,623
31,815 10.67 3,396 45,672 9.09 4,150 23,357 6.04 1,412
103,768 6.84 7,093 129,967 6.73 8,741 67,325 5.99 4,035
32,611 6.45 2,102 32,022 7.16 2,291 13,956 7.17 1,000
154,338 6.63 10,236 177,523 6.73 11,941 89,675 6.22 5,577
36,716 4.73 1,736 37,416 5.16 1,930 25,656 6.13 1,573
3,773 2.67 101 6,293 2.90 183 837 5.69 48
149,576 4.80 7,186 180,924 4.22 7,643 98,620 6.12 6,034
98,497 3.89 3,836 96,273 3.50 3,365 41,659 5.80 2,416
31,286 3.36 1,051 40,885 2.91 1,190 19,453 5.08 988
13,451 9.21 1,239 14,751 9.32 1,375 7,141 5.62 401
29,726 3.49 1,037 30,661 3.95 1,212 7,127 10.50 748
322,536 4.45 14,349 363,494 4.07 14,785 174,000 6.08 10,587
235,568 5.18 12,206 238,359 5.45 12,992 75,116 6.67 5,008
101,537 4.45 4,519 106,957 4.76 5,089 75,375 6.55 4,934
22,375 13.35 2,987 23,357 12.16 2,841 19,601 12.13 2,378
88,585 6.49 5,747 90,666 6.56 5,952 54,368 8.72 4,744
448,065 5.68 25,459 459,339 5.85 26,874 224,460 7.60 17,064
770,601 5.17 39,808 822,833 5.06 41,659 398,460 6.94 27,651
5,849 3.56 207 6,113 3.05 186 1,920 4.73 91
$ 1,064,158 5.02 % $ 53,439 1,098,139 5.19 % $ 56,993 526,812 6.69 % $ 35,219
$ 60,941 0.12 % $ 72 70,179 0.14 % $ 100 5,650 1.12 % $ 64
416,877 0.26 1,088 351,892 0.39 1,375 166,691 1.32 2,195
87,133 1.43 1,247 140,197 1.24 1,738 39,481 3.08 1,215
14,654 2.07 302 20,459 2.03 415 6,656 2.83 187
55,097 0.22 123 53,166 0.27 146 47,578 1.81 860
634,702 0.45 2,832 635,893 0.59 3,774 266,056 1.70 4,521
46,824 0.22 106 51,972 0.44 231 65,826 2.25 1,478
185,426 2.64 4,888 231,801 2.50 5,786 102,283 3.70 3,789
6,863 3.31 227 4,904 3.50 172 - - -
873,815 0.92 8,053 924,570 1.08 9,963 434,165 2.25 9,788
190,343 - - 173,569 - - 92,647 - -
$ 1,064,158 0.76 8,053 1,098,139 0.91 9,963 526,812 1.86 9,788
4.26 % $ 45,386 4.28 % $ 47,030 4.83 % $ 25,431
$ 17,618 19,218 11,175
24,824 23,997 13,353
120,338 121,000 53,056
$ 162,780 164,215 77,584
$ 183,008 171,712 87,820
47,877 48,193 28,658
122,238 117,879 53,753
(190,343) (173,569) (92,647)
$ 162,780 164,215 77,584
$ 1,226,938 1,262,354 604,396
(5) The average balance amounts represent amortized cost for the periods presented.
(6) Nonaccrual loans and related income are included in their respective loan categories.
(7) Includes taxable-equivalent adjustments of $701 million, $696 million, $629 million, $706 million and $288 million for 2012, 2011, 2010, 2009 and 2008, respectively,
primarily related to tax-exempt income on certain loans and securities. The federal statutory tax rate utilized was 35% for the periods presented.
39