Wells Fargo 2012 Annual Report Download - page 50
Download and view the complete annual report
Please find page 50 of the 2012 Wells Fargo annual report below. You can navigate through the pages in the report by either clicking on the pages listed below, or by using the keyword search tool below to find specific information within the annual report.-
 1
1 -
2
-
3
-
4
-
5
-
6
-
7
-
8
-
9
-
10
-
11
-
12
-
13
-
14
-
15
-
16
-
17
-
18
-
19
-
20
-
21
-
22
-
23
-
24
-
25
-
26
-
27
-
28
-
29
-
30
-
31
-
32
-
33
-
34
-
35
-
36
-
37
-
38
-
39
-
 40
40 -
 41
41 -
 42
42 -
 43
43 -
 44
44 -
 45
45 -
 46
46 -
 47
47 -
 48
48 -
 49
49 -
 50
50 -
 51
51 -
 52
52 -
 53
53 -
 54
54 -
 55
55 -
 56
56 -
 57
57 -
 58
58 -
 59
59 -
 60
60 -
61
-
62
-
63
-
64
-
65
-
66
-
67
-
68
-
69
-
70
-
71
-
72
-
73
-
74
-
75
-
76
-
77
-
78
-
79
-
80
-
81
-
82
-
83
-
84
-
85
-
86
-
87
-
88
-
89
-
90
-
91
-
92
-
93
-
94
-
95
-
96
-
97
-
98
-
99
-
100
-
101
-
102
-
103
-
104
-
105
-
106
-
107
-
108
-
109
-
110
-
111
-
112
-
113
-
114
-
115
-
116
-
117
-
118
-
119
-
120
-
121
-
122
-
123
-
124
-
125
-
126
-
127
-
128
-
129
-
130
-
131
-
132
-
133
-
134
-
135
-
136
-
137
-
138
-
139
-
140
-
141
-
142
-
143
-
144
-
145
-
146
-
147
-
148
-
149
-
150
-
151
-
152
-
153
-
154
-
155
-
156
-
157
-
158
-
159
-
160
-
161
-
162
-
163
-
164
-
165
-
166
-
167
-
168
-
169
-
170
-
171
-
172
-
173
-
174
-
175
-
176
-
177
-
178
-
179
-
180
-
181
-
182
-
183
-
184
-
185
-
186
-
187
-
188
-
189
-
190
-
191
-
192
-
193
-
194
-
195
-
196
-
197
-
198
-
199
-
200
-
201
-
202
-
203
-
204
-
205
-
206
-
207
-
208
-
209
-
210
-
211
-
212
-
213
-
214
-
215
-
216
-
217
-
218
-
219
-
220
-
221
-
222
-
223
-
224
-
225
-
226
-
227
-
228
-
229
-
230
-
231
-
232
-
233
-
234
-
235
-
236
-
237
-
238
-
239
-
240
-
241
-
242
-
243
-
244
-
245
-
246
-
247
-
248
-
249
-
250
-
251
-
252
 |
 |

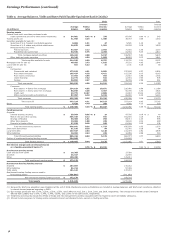
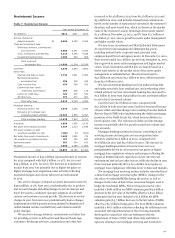
Balance Sheet Analysis (continued)
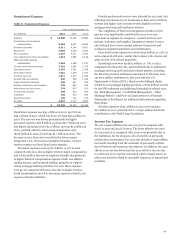
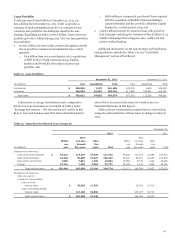
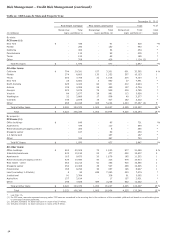
Deposits
Deposits totaled $1.0 trillion at December 31, 2012, compared
with $920.1 billion at December 31, 2011. Table 14 provides
additional information regarding deposits. Information
regarding the impact of deposits on net interest income and a
comparison of average deposit balances is provided in
“Earnings Performance – Net Interest Income” and Table 5
earlier in this Report. Total core deposits were $945.7 billion at
December 31, 2012, up $73.1 billion from $872.6 billion at
December 31, 2011.
Table 14: Deposits
% o
f
% o
f
Dec. 31, total Dec. 31, total %
($ in millions) 2012 deposits 2011 deposits Change
Noninterest-bearing $ 288,207 29 % $ 243,961 26 % 18
Interest-bearing checking 35,275 4 37,027 4 (5)
Market rate and other savings 517,464 52 485,534 53 7
Savings certificates 55,966 6 63,617 7 (12)
Foreign deposits (1) 48,837 4 42,490 5 15
Core deposits 945,749 95 872,629 95 8
Other time and savings deposits 33,755 3 20,745 2 63
Other foreign deposits 23,331 2 26,696 3 (13)
Total deposits $ 1,002,835 100 % $ 920,070 100 % 9
(1) Reflects Eurodollar sweep balances included in core deposits.
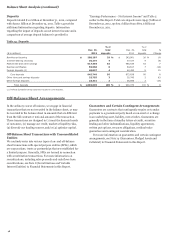
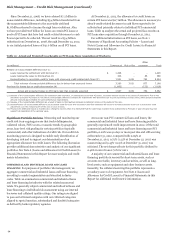
Off-Balance Sheet Arrangements
In the ordinary course of business, we engage in financial
transactions that are not recorded in the balance sheet, or may
be recorded in the balance sheet in amounts that are different
from the full contract or notional amount of the transaction.
These transactions are designed to (1) meet the financial needs
of customers, (2) manage our credit, market or liquidity risks,
(3) diversify our funding sources, and/or (4) optimize capital.
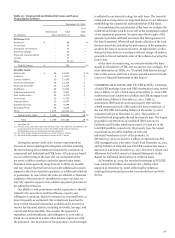
Off-Balance Sheet Transactions with Unconsolidated
Entities
We routinely enter into various types of on- and off-balance
sheet transactions with special purpose entities (SPEs), which
are corporations, trusts or partnerships that are established for
a limited purpose. Generally, SPEs are formed in connection
with securitization transactions. For more information on
securitizations, including sales proceeds and cash flows from
securitizations, see Note 8 (Securitizations and Variable
Interest Entities) to Financial Statements in this Report.
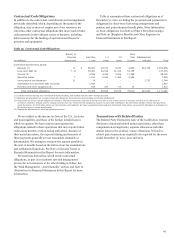
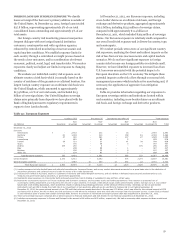
Guarantees and Certain Contingent Arrangements
Guarantees are contracts that contingently require us to make
payments to a guaranteed party based on an event or a change
in an underlying asset, liability, rate or index. Guarantees are
generally in the form of standby letters of credit, securities
lending and other indemnifications, liquidity agreements,
written put options, recourse obligations, residual value
guarantees and contingent consideration.
For more information on guarantees and certain contingent
arrangements, see Note 14 (Guarantees, Pledged Assets and
Collateral) to Financial Statements in this Report.
48