Wells Fargo 2012 Annual Report Download - page 65
Download and view the complete annual report
Please find page 65 of the 2012 Wells Fargo annual report below. You can navigate through the pages in the report by either clicking on the pages listed below, or by using the keyword search tool below to find specific information within the annual report.-
 1
1 -
2
-
3
-
4
-
5
-
6
-
7
-
8
-
9
-
10
-
11
-
12
-
13
-
14
-
15
-
16
-
17
-
18
-
19
-
20
-
21
-
22
-
23
-
24
-
25
-
26
-
27
-
28
-
29
-
30
-
31
-
32
-
33
-
34
-
35
-
36
-
37
-
38
-
39
-
40
-
41
-
42
-
43
-
44
-
45
-
46
-
47
-
48
-
49
-
50
-
51
-
52
-
53
-
54
-
 55
55 -
 56
56 -
 57
57 -
 58
58 -
 59
59 -
 60
60 -
 61
61 -
 62
62 -
 63
63 -
 64
64 -
 65
65 -
 66
66 -
 67
67 -
 68
68 -
 69
69 -
 70
70 -
 71
71 -
 72
72 -
 73
73 -
 74
74 -
 75
75 -
76
-
77
-
78
-
79
-
80
-
81
-
82
-
83
-
84
-
85
-
86
-
87
-
88
-
89
-
90
-
91
-
92
-
93
-
94
-
95
-
96
-
97
-
98
-
99
-
100
-
101
-
102
-
103
-
104
-
105
-
106
-
107
-
108
-
109
-
110
-
111
-
112
-
113
-
114
-
115
-
116
-
117
-
118
-
119
-
120
-
121
-
122
-
123
-
124
-
125
-
126
-
127
-
128
-
129
-
130
-
131
-
132
-
133
-
134
-
135
-
136
-
137
-
138
-
139
-
140
-
141
-
142
-
143
-
144
-
145
-
146
-
147
-
148
-
149
-
150
-
151
-
152
-
153
-
154
-
155
-
156
-
157
-
158
-
159
-
160
-
161
-
162
-
163
-
164
-
165
-
166
-
167
-
168
-
169
-
170
-
171
-
172
-
173
-
174
-
175
-
176
-
177
-
178
-
179
-
180
-
181
-
182
-
183
-
184
-
185
-
186
-
187
-
188
-
189
-
190
-
191
-
192
-
193
-
194
-
195
-
196
-
197
-
198
-
199
-
200
-
201
-
202
-
203
-
204
-
205
-
206
-
207
-
208
-
209
-
210
-
211
-
212
-
213
-
214
-
215
-
216
-
217
-
218
-
219
-
220
-
221
-
222
-
223
-
224
-
225
-
226
-
227
-
228
-
229
-
230
-
231
-
232
-
233
-
234
-
235
-
236
-
237
-
238
-
239
-
240
-
241
-
242
-
243
-
244
-
245
-
246
-
247
-
248
-
249
-
250
-
251
-
252
 |
 |

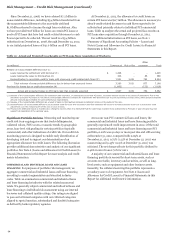
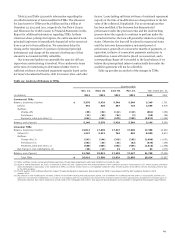
We monitor the number of borrowers paying the minimum
amount due on a monthly basis. In December 2012,
approximately 44% of our borrowers with a home equity
outstanding balance paid only the minimum amount due; 93%
paid the minimum or more.
The home equity liquidating portfolio includes home equity
loans generated through third party channels, including
correspondent loans. This liquidating portfolio represents less
than 1% of our total loans outstanding at December 31, 2012,
and contains some of the highest risk in our home equity
portfolio, with a loss rate of 9.03% compared with 3.03% for the
core (non-liquidating) home equity portfolio at
December 31, 2012.
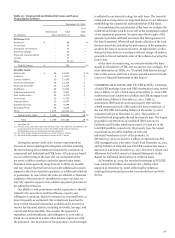
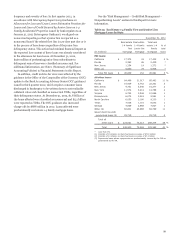
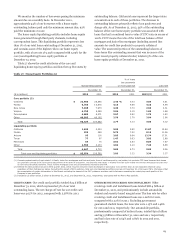
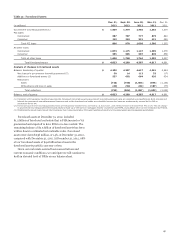
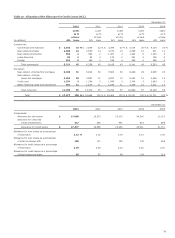
Table 27 shows the credit attributes of the core and
liquidating home equity portfolios and lists the top five states by
outstanding balance. California loans represent the largest state
concentration in each of these portfolios. The decrease in
outstanding balances primarily reflects loan paydowns and
charge-offs. As of December 31, 2012, 34% of the outstanding
balance of the core home equity portfolio was associated with
loans that had a combined loan to value (CLTV) ratio in excess of
100%. CLTV means the ratio of the total loan balance of first
mortgages and junior lien mortgages (including unused line
amounts for credit line products) to property collateral
value. The unsecured portion of the outstanding balances of
these loans (the outstanding amount that was in excess of the
most recent property collateral value) totaled 15% of the core
home equity portfolio at December 31, 2012.
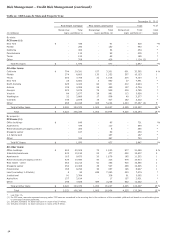
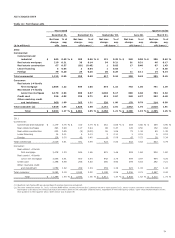
Table 27: Home Equity Portfolios (1)
% of loans
two payments
Outstanding balance or more past due Loss rate
December 31, December 31, December 31,
($ in millions) 2012 2011 2012 2011 2012 (2) 2011
Core portfolio (3)
California $ 22,900 25,555 2.46 % 3.03 3.59 3.61
Florida 9,763 10,870 4.15 4.99 4.10 4.99
New Jersey 7,338 7,973 3.43 3.73 2.50 2.31
Virginia 4,758 5,248 2.04 2.15 1.83 1.68
Pennsylvania 4,683 5,071 2.67 2.82 1.72 1.40
Other 40,985 46,165 2.59 2.79 2.84 2.66
Total 90,427 100,882 2.77 3.13 3.03 3.02
Liquidating portfolio
California 1,633 2,024 3.99 5.50 11.87 12.64
Florida 223 265 5.79 7.02 8.15 11.56
Arizona 95 116 3.85 6.64 12.74 17.51
Texas 77 97 1.47 0.93 3.02 2.89
Minnesota 64 75 3.62 2.83 8.84 7.67
Other 2,555 3,133 3.62 4.13 7.33 6.88
Total 4,647 5,710 3.82 4.73 9.03 9.36
Total core and liquidating portfolios $ 95,074 106,592 2.82 3.22 3.34 3.37
(1) Consists predominantly of real estate 1-4 family junior lien mortgages and first and junior lines of credit secured by real estate, but excludes PCI loans because their losses
are generally covered by PCI accounting adjustment at the date of acquisition, and excludes real estate 1-4 family first lien open-ended line reverse mortgages because they
do not have scheduled payments. These reverse mortgage loans are predominantly insured by the FHA.
(2) Reflects the OCC guidance issued in third quarter 2012, which requires consumer loans discharged in bankruptcy to be written down to net realizable collateral value,
regardless of their delinquency status. Excluding the impact of OCC guidance, total core and liquidating portfolio loss rate at December 31, 2012 was 2.76%. We believe that
the presentation of certain information in this Report excluding the impact of the OCC guidance provides useful disclosure regarding the underlying credit quality of the
Company’s loan portfolios.
(3) Includes $1.3 billion and $1.5 billion at December 31, 2012, and December 31, 2011, respectively, associated with the Pick-a-Pay portfolio.
CREDIT CARDS Our credit card portfolio totaled $24.6 billion at
December 31, 2012, which represented 3% of our total
outstanding loans. The net charge-off rate for our credit card
loans was 4.02% for 2012, compared with 5.58% for 2011.
OTHER REVOLVING CREDIT AND INSTALLMENT Other
revolving credit and installment loans totaled $88.4 billion at
December 31, 2012, and predominantly include automobile,
student and security-based margin loans. The loss rate for other
revolving credit and installment loans was 1.00% for 2012,
compared with 1.22% for 2011. Excluding government
guaranteed student loans, the loss rates were 1.15% and 1.46%
for 2012 and 2011, respectively. Our automobile portfolio,
predominantly composed of indirect loans, totaled $46.0 billion
and $43.5 billion at December 31, 2012 and 2011, respectively,
and had a loss rate of 0.64% and 0.82% in 2012 and 2011,
respectively.
63