Wells Fargo 2012 Annual Report Download - page 209
Download and view the complete annual report
Please find page 209 of the 2012 Wells Fargo annual report below. You can navigate through the pages in the report by either clicking on the pages listed below, or by using the keyword search tool below to find specific information within the annual report.-
 1
1 -
2
-
3
-
4
-
5
-
6
-
7
-
8
-
9
-
10
-
11
-
12
-
13
-
14
-
15
-
16
-
17
-
18
-
19
-
20
-
21
-
22
-
23
-
24
-
25
-
26
-
27
-
28
-
29
-
30
-
31
-
32
-
33
-
34
-
35
-
36
-
37
-
38
-
39
-
40
-
41
-
42
-
43
-
44
-
45
-
46
-
47
-
48
-
49
-
50
-
51
-
52
-
53
-
54
-
55
-
56
-
57
-
58
-
59
-
60
-
61
-
62
-
63
-
64
-
65
-
66
-
67
-
68
-
69
-
70
-
71
-
72
-
73
-
74
-
75
-
76
-
77
-
78
-
79
-
80
-
81
-
82
-
83
-
84
-
85
-
86
-
87
-
88
-
89
-
90
-
91
-
92
-
93
-
94
-
95
-
96
-
97
-
98
-
99
-
100
-
101
-
102
-
103
-
104
-
105
-
106
-
107
-
108
-
109
-
110
-
111
-
112
-
113
-
114
-
115
-
116
-
117
-
118
-
119
-
120
-
121
-
122
-
123
-
124
-
125
-
126
-
127
-
128
-
129
-
130
-
131
-
132
-
133
-
134
-
135
-
136
-
137
-
138
-
139
-
140
-
141
-
142
-
143
-
144
-
145
-
146
-
147
-
148
-
149
-
150
-
151
-
152
-
153
-
154
-
155
-
156
-
157
-
158
-
159
-
160
-
161
-
162
-
163
-
164
-
165
-
166
-
167
-
168
-
169
-
170
-
171
-
172
-
173
-
174
-
175
-
176
-
177
-
178
-
179
-
180
-
181
-
182
-
183
-
184
-
185
-
186
-
187
-
188
-
189
-
190
-
191
-
192
-
193
-
194
-
195
-
196
-
197
-
198
-
 199
199 -
 200
200 -
 201
201 -
 202
202 -
 203
203 -
 204
204 -
 205
205 -
 206
206 -
 207
207 -
 208
208 -
 209
209 -
 210
210 -
 211
211 -
 212
212 -
 213
213 -
 214
214 -
 215
215 -
 216
216 -
 217
217 -
 218
218 -
 219
219 -
220
-
221
-
222
-
223
-
224
-
225
-
226
-
227
-
228
-
229
-
230
-
231
-
232
-
233
-
234
-
235
-
236
-
237
-
238
-
239
-
240
-
241
-
242
-
243
-
244
-
245
-
246
-
247
-
248
-
249
-
250
-
251
-
252
 |
 |

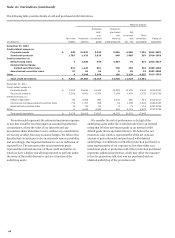
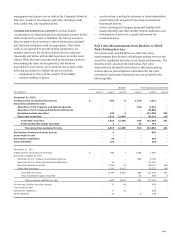
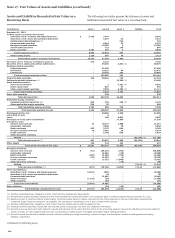
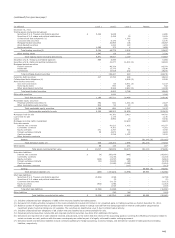
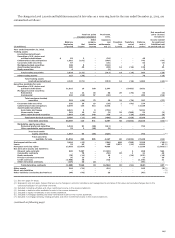
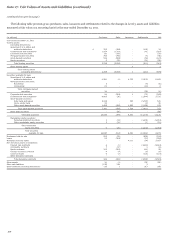
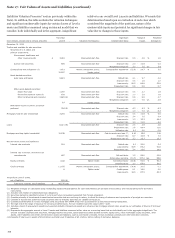
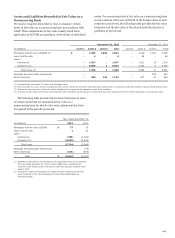
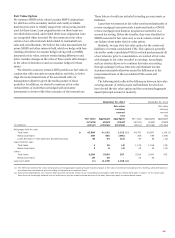
The changes in Level 3 assets and liabilities measured at fair value on a recurring basis for the year ended December 31, 2012, are
summarized as follows:
Net unrealized
Total net gains Purchases, gains (losses)
(losses) included in sales, included in
Other issuances income related
Balance, compre- and Transfers Transfers Balance, to assets and
beginning Net hensive settlements, into out of end of liabilities held
(in millions) of period income income net (1) Level 3 Level 3 period at period end (2)
Year ended December 31, 2012
Trading assets
(excluding derivatives):
Securities of U.S. states and
p
olitical subdivisions $ 53 3 -
(
10
)
- - 46 -
Collateralized debt obligations 1,582 (191) - (649) - - 742 (47)
Corporate debt securities 97 - - (45) - - 52 (3)
Mortgage-backed securities 108 8 - (110) - - 6 2
Asset-backed securities 190 48 - (98) 14 (16) 138 23
Equity securities 4 - - (1) - - 3 -
Total trading securities 2,034 (132) - (913) 14 (16) 987 (25)
Other trading assets 115 (39) - - - - 76 (19)
Total trading assets
(excluding derivatives) 2,149 (171) - (913) 14 (16) 1,063 (44)(3)
Securities available for sale:
Securities of U.S. states and
political subdivisions 11,516 10 160 1,347 - (9,402) 3,631 -
Mortgage-backed securities:
Residential 61 12 16 50 29 (74) 94 (1)
Commercial 232 (56) 57 (30) - - 203 (56)
Total mortgage-backed
securities 293 (44) 73 20 29 (74) 297 (57)
Corporate debt securities 295 20 19 (20) 1 (41) 274 -
Collateralized debt obligations 8,599 135 514 3,940 - - 13,188 -
Asset-backed securities:
Auto loans and leases 6,641 3 3 (726) - - 5,921 -
Home equity loans 282 15 14 (3) 29 (286) 51 (1)
Other asset-backed securities 2,863
(
29
)
148 329 1
(
29
)
3,283
(
6
)
Total asset-backed securities 9,786 (11) 165 (400) 30 (315) 9,255 (7)
Total debt securities 30,489 110 931 4,887 60
(
9,832
)
26,645
(
64
)
(
4
)
Marketable equity securities:
Perpetual preferred securities 1,344 91 (30) (611) - - 794 -
Other marketable equity securities 23 2 (16) (9) - - - -
Total marketable
equity securities 1,367 93 (46) (620) - - 794 - (5)
Total securities
available for sale 31,856 203 885 4,267 60 (9,832) 27,439 (64)
Mortgages held for sale 3,410 (42) - (308) 488 (298) 3,250 (30)(6)
Loans 23 43 - 145 5,851 (41) 6,021 43 (6)
Mortgage servicing rights 12,603 (5,954) - 4,889 - - 11,538 (2,893)(6)
Net derivative assets and liabilities:
Interest rate contracts 609 7,397 - (7,349) - 2 659 562
Commodity contracts - 78 - (50) (8) 1 21 40
Equity contracts (75) (11) - 18 - (54) (122) (16)
Foreign exchange contracts (7) 23 - 5 - - 21 30
Credit contracts (1,998) 38 - 810 - - (1,150) 41
Other derivative contracts
(
117
)
40 (1) - - - (78) -
Total derivative contracts (1,588) 7,565 (1) (6,566) (8) (51) (649) 657 (7)
Other assets 244 (21) - (61) - - 162 (8)(3)
Short sale liabilities - - - - - - - - (3)
Other liabilities (excluding derivatives) (44) (43) - 38 - - (49) - (6)
(1) See next page for detail.
(2) Represents only net gains (losses) that are due to changes in economic conditions and management’s estimates of fair value and excludes changes due to the
collection/realization of cash flows over time.
(3) Included in trading activities and other noninterest income in the income statement.
(4) Included in debt securities available for sale in the income statement.
(5) Included in equity investments in the income statement.
(6) Included in mortgage banking and other noninterest income in the income statement.
(7) Included in mortgage banking, trading activities and other noninterest income in the income statement.
(continued on following page)
207