Wells Fargo 2012 Annual Report Download - page 217
Download and view the complete annual report
Please find page 217 of the 2012 Wells Fargo annual report below. You can navigate through the pages in the report by either clicking on the pages listed below, or by using the keyword search tool below to find specific information within the annual report.-
 1
1 -
2
-
3
-
4
-
5
-
6
-
7
-
8
-
9
-
10
-
11
-
12
-
13
-
14
-
15
-
16
-
17
-
18
-
19
-
20
-
21
-
22
-
23
-
24
-
25
-
26
-
27
-
28
-
29
-
30
-
31
-
32
-
33
-
34
-
35
-
36
-
37
-
38
-
39
-
40
-
41
-
42
-
43
-
44
-
45
-
46
-
47
-
48
-
49
-
50
-
51
-
52
-
53
-
54
-
55
-
56
-
57
-
58
-
59
-
60
-
61
-
62
-
63
-
64
-
65
-
66
-
67
-
68
-
69
-
70
-
71
-
72
-
73
-
74
-
75
-
76
-
77
-
78
-
79
-
80
-
81
-
82
-
83
-
84
-
85
-
86
-
87
-
88
-
89
-
90
-
91
-
92
-
93
-
94
-
95
-
96
-
97
-
98
-
99
-
100
-
101
-
102
-
103
-
104
-
105
-
106
-
107
-
108
-
109
-
110
-
111
-
112
-
113
-
114
-
115
-
116
-
117
-
118
-
119
-
120
-
121
-
122
-
123
-
124
-
125
-
126
-
127
-
128
-
129
-
130
-
131
-
132
-
133
-
134
-
135
-
136
-
137
-
138
-
139
-
140
-
141
-
142
-
143
-
144
-
145
-
146
-
147
-
148
-
149
-
150
-
151
-
152
-
153
-
154
-
155
-
156
-
157
-
158
-
159
-
160
-
161
-
162
-
163
-
164
-
165
-
166
-
167
-
168
-
169
-
170
-
171
-
172
-
173
-
174
-
175
-
176
-
177
-
178
-
179
-
180
-
181
-
182
-
183
-
184
-
185
-
186
-
187
-
188
-
189
-
190
-
191
-
192
-
193
-
194
-
195
-
196
-
197
-
198
-
199
-
200
-
201
-
202
-
203
-
204
-
205
-
206
-
 207
207 -
 208
208 -
 209
209 -
 210
210 -
 211
211 -
 212
212 -
 213
213 -
 214
214 -
 215
215 -
 216
216 -
 217
217 -
 218
218 -
 219
219 -
 220
220 -
 221
221 -
 222
222 -
 223
223 -
 224
224 -
 225
225 -
 226
226 -
 227
227 -
228
-
229
-
230
-
231
-
232
-
233
-
234
-
235
-
236
-
237
-
238
-
239
-
240
-
241
-
242
-
243
-
244
-
245
-
246
-
247
-
248
-
249
-
250
-
251
-
252
 |
 |

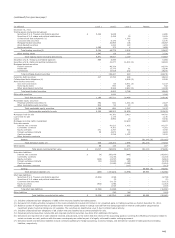
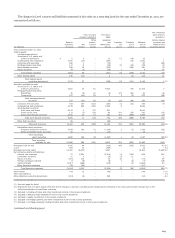
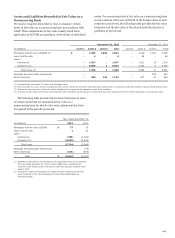
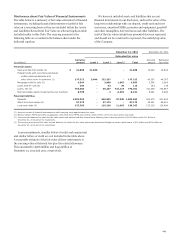
Assets and Liabilities Recorded at Fair Value on a
Nonrecurring Basis
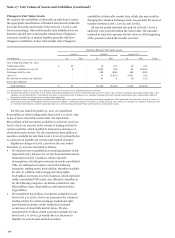
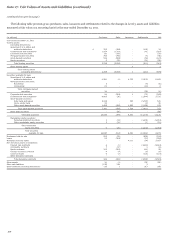
We may be required, from time to time, to measure certain
assets at fair value on a nonrecurring basis in accordance with
GAAP. These adjustments to fair value usually result from
application of LOCOM accounting or write-downs of individual
assets. For assets measured at fair value on a nonrecurring basis
in 2012 and 2011 that were still held in the balance sheet at each
respective period end, the following table provides the fair value
hierarchy and the fair value of the related individual assets or
portfolios at period end.
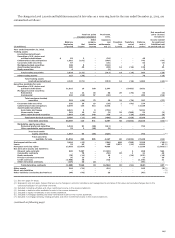
December 31, 2012 December 31, 2011
(in millions) Level 1 Level 2 Level 3 Total Level 1 Level 2 Level 3 Total
Mortgages held for sale (LOCOM) (1) $ - 1,509 1,045 2,554 - 1,019 1,166 2,185
Loans held for sale - 4 - 4 - 86 - 86
Loans:
Commercial - 1,507 - 1,507 - 1,501 13 1,514
Consumer (2) - 5,889 4 5,893 - 4,163 4 4,167
Total loans (3) - 7,396 4 7,400 - 5,664 17 5,681
Mortgage servicing rights (amortized) - - - - - - 293 293
Other assets (4) - 989 144 1,133 - 537 67 604
(1) Predominantly real estate 1-4 family first mortgage loans.
(2) The December 31, 2012, amount includes fair value of $2.0 billion for consumer loans that were written down in accordance with OCC guidance issued in third quarter 2012.
(3) Represents carrying value of loans for which adjustments are based on the appraised value of the collateral.
(4) Includes the fair value of foreclosed real estate and other collateral owned that were measured at fair value subsequent to their initial classification as foreclosed assets.
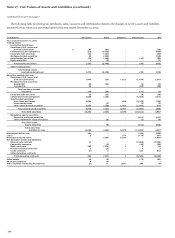
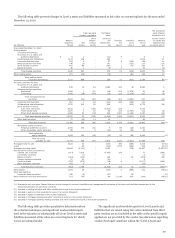
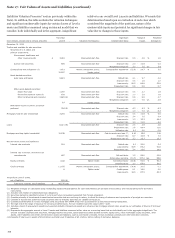
The following table presents the increase (decrease) in value
of certain assets that are measured at fair value on a
nonrecurring basis for which a fair value adjustment has been
recognized in the periods presented.
Year ended December 31,
(in millions) 2012 2011
Mortgages held for sale (LOCOM) $ 37 29
Loans held for sale 1 22
Loans:
Commercial (795) (1,043)
Consumer (1) (4,989) (4,905)
Total loans (5,784) (5,948)
Mortgage servicing rights (amortized) - (34)
Other assets (2) (316) (256)
Total $ (6,062) (6,187)
(1) Represents write-downs of loans based on the appraised value of the collateral.
The year ended December 31, 2012, includes $888 million resulting from
consumer loans written down in accordance with OCC guidance issued in third
quarter 2012.
(2) Includes the losses on foreclosed real estate and other collateral owned that
were measured at fair value subsequent to their initial classification as
foreclosed assets.
215