Wells Fargo 2012 Annual Report Download - page 232
Download and view the complete annual report
Please find page 232 of the 2012 Wells Fargo annual report below. You can navigate through the pages in the report by either clicking on the pages listed below, or by using the keyword search tool below to find specific information within the annual report.-
 1
1 -
2
-
3
-
4
-
5
-
6
-
7
-
8
-
9
-
10
-
11
-
12
-
13
-
14
-
15
-
16
-
17
-
18
-
19
-
20
-
21
-
22
-
23
-
24
-
25
-
26
-
27
-
28
-
29
-
30
-
31
-
32
-
33
-
34
-
35
-
36
-
37
-
38
-
39
-
40
-
41
-
42
-
43
-
44
-
45
-
46
-
47
-
48
-
49
-
50
-
51
-
52
-
53
-
54
-
55
-
56
-
57
-
58
-
59
-
60
-
61
-
62
-
63
-
64
-
65
-
66
-
67
-
68
-
69
-
70
-
71
-
72
-
73
-
74
-
75
-
76
-
77
-
78
-
79
-
80
-
81
-
82
-
83
-
84
-
85
-
86
-
87
-
88
-
89
-
90
-
91
-
92
-
93
-
94
-
95
-
96
-
97
-
98
-
99
-
100
-
101
-
102
-
103
-
104
-
105
-
106
-
107
-
108
-
109
-
110
-
111
-
112
-
113
-
114
-
115
-
116
-
117
-
118
-
119
-
120
-
121
-
122
-
123
-
124
-
125
-
126
-
127
-
128
-
129
-
130
-
131
-
132
-
133
-
134
-
135
-
136
-
137
-
138
-
139
-
140
-
141
-
142
-
143
-
144
-
145
-
146
-
147
-
148
-
149
-
150
-
151
-
152
-
153
-
154
-
155
-
156
-
157
-
158
-
159
-
160
-
161
-
162
-
163
-
164
-
165
-
166
-
167
-
168
-
169
-
170
-
171
-
172
-
173
-
174
-
175
-
176
-
177
-
178
-
179
-
180
-
181
-
182
-
183
-
184
-
185
-
186
-
187
-
188
-
189
-
190
-
191
-
192
-
193
-
194
-
195
-
196
-
197
-
198
-
199
-
200
-
201
-
202
-
203
-
204
-
205
-
206
-
207
-
208
-
209
-
210
-
211
-
212
-
213
-
214
-
215
-
216
-
217
-
218
-
219
-
220
-
221
-
 222
222 -
 223
223 -
 224
224 -
 225
225 -
 226
226 -
 227
227 -
 228
228 -
 229
229 -
 230
230 -
 231
231 -
 232
232 -
 233
233 -
 234
234 -
 235
235 -
 236
236 -
 237
237 -
 238
238 -
 239
239 -
 240
240 -
 241
241 -
 242
242 -
243
-
244
-
245
-
246
-
247
-
248
-
249
-
250
-
251
-
252
 |
 |

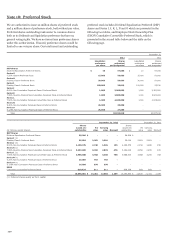
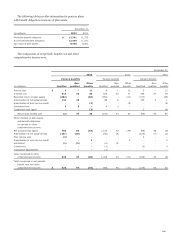
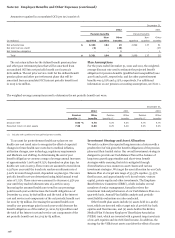
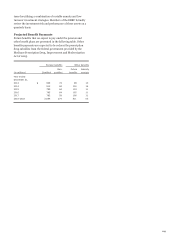
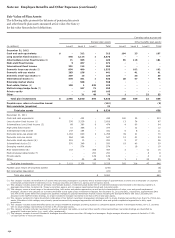
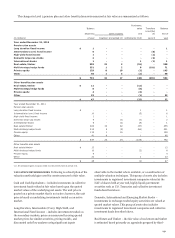
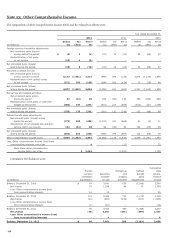
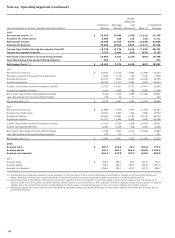
Note 20: Employee Benefits and Other Expenses (continued)
Fair Value of Plan Assets
The following table presents the balances of pension plan assets
and other benefit plan assets measured at fair value. See Note 17
for fair value hierarchy level definitions.
Carrying value at year end
Pension plan assets Other benefits plan assets
(in millions) Level 1 Level 2 Level 3 Total Level 1 Level 2 Level 3 Total
December 31, 2012
Cash and cash equivalents $ - 312 - 312 164 23 - 187
Long duration fixed income (1) 545 3,124 1 3,670 - - - -
Intermediate (core) fixed income (2) 71 355 - 426 65 116 - 181
High-yield fixed income 5 367 - 372 - - - -
International fixed income 251 112 - 363 - - - -
Domestic large-cap stocks (3) 854 499 - 1,353 - 102 - 102
Domestic mid-cap stocks 283 158 - 441 - 41 - 41
Domestic small-cap stocks (4) 309 15 - 324 - 30 - 30
International stocks (5) 578 341 1 920 28 47 - 75
Emerging market stocks - 538 - 538 - - - -
Real estate/timber (6) 100 1 328 429 - - - -
Multi-strategy hedge funds (7) - 187 71 258 - - - -
Private equity - - 145 145 - - - -
Other - 31 48 79 1 - 22 23
Total plan investments $ 2,996 6,040 594 9,630 258 359 22 639
Payable upon return of securities loaned (112) (3)
Net receivables (payables) 21 -
Total plan assets $ 9,539 636
December 31, 2011
Cash and cash equivalents $ - 432 - 432 180 33 - 213
Long duration fixed income (1) 376 2,229 1 2,606 13 74 - 87
Intermediate (core) fixed income (2) 88 380 6 474 4 60 - 64
High-yield fixed income 10 366 1 377 - 12 - 12
International fixed income 147 184 - 331 5 6 - 11
Domestic large-cap stocks (3) 1,163 600 2 1,765 39 31 - 70
Domestic mid-cap stocks 364 183 - 547 12 21 - 33
Domestic small-cap stocks (4) 281 10 - 291 9 17 - 26
International stocks (5) 570 349 1 920 19 40 - 59
Emerging market stocks - 574 - 574 - 19 - 19
Real estate/timber (6) 102 - 355 457 3 - 12 15
Multi-strategy hedge funds (7) - - 251 251 - - 8 8
Private equity - - 129 129 - - 4 4
Other - 29 46 75 1 1 23 25
Total plan investments $ 3,101 5,336 792 9,229 285 314 47 646
Payable upon return of securities loaned (145) (5)
Net receivables (payables) (23) (1)
Total plan assets $ 9,061 640
(1) This category includes a diversified mix of assets which are being managed in accordance with a duration target of approximately 10 years and an emphasis on corporate
credit bonds combined with investments in U.S. Treasury securities and other U.S. agency and non-agency bonds.
(2) This category includes assets that are primarily intermediate duration, investment grade bonds held in investment strategies benchmarked to the Barclays Capital U.S.
Aggregate Bond Index. Includes U.S. Treasury securities, agency and non-agency asset-backed bonds and corporate bonds.
(3) This category covers a broad range of investment styles, both active and passive approaches, as well as style characteristics of value, core and growth emphasized
strategies. Assets in this category are currently diversified across eight unique investment strategies. For December 31, 2012 and 2011, respectively, approximately 24%
and 34% of the assets within this category are passively managed to popular mainstream market indexes including the Standard & Poor's 500 Index; excluding the
allocation to the S&P 500 Index strategy, no single investment manager represents more than 2.5% of total plan assets.
(4) This category consists of a highly diversified combination of four distinct investment management strategies with no single strategy representing more than 2% of total plan
assets. Allocations in this category are primarily spread across actively managed approaches with distinct value and growth emphasized approaches in fairly equal
proportions.
(5) This category includes assets diversified across six unique investment strategies providing exposure to companies based primarily in developed market, non-U.S. countries
with no single strategy representing more than 2.5% of total plan assets.
(6) This category primarily includes investments in private and public real estate, as well as timber specific limited partnerships; real estate holdings are diversified by
geographic location and sector (e.g., retail, office, apartments).
(7) This category consists of several investment strategies diversified across more than 30 hedge fund managers. Single manager allocation exposure is limited to 0.15%
(15 basis points) of total plan assets.
230