Wells Fargo 2012 Annual Report Download - page 78
Download and view the complete annual report
Please find page 78 of the 2012 Wells Fargo annual report below. You can navigate through the pages in the report by either clicking on the pages listed below, or by using the keyword search tool below to find specific information within the annual report.-
 1
1 -
2
-
3
-
4
-
5
-
6
-
7
-
8
-
9
-
10
-
11
-
12
-
13
-
14
-
15
-
16
-
17
-
18
-
19
-
20
-
21
-
22
-
23
-
24
-
25
-
26
-
27
-
28
-
29
-
30
-
31
-
32
-
33
-
34
-
35
-
36
-
37
-
38
-
39
-
40
-
41
-
42
-
43
-
44
-
45
-
46
-
47
-
48
-
49
-
50
-
51
-
52
-
53
-
54
-
55
-
56
-
57
-
58
-
59
-
60
-
61
-
62
-
63
-
64
-
65
-
66
-
67
-
 68
68 -
 69
69 -
 70
70 -
 71
71 -
 72
72 -
 73
73 -
 74
74 -
 75
75 -
 76
76 -
 77
77 -
 78
78 -
 79
79 -
 80
80 -
 81
81 -
 82
82 -
 83
83 -
 84
84 -
 85
85 -
 86
86 -
 87
87 -
 88
88 -
89
-
90
-
91
-
92
-
93
-
94
-
95
-
96
-
97
-
98
-
99
-
100
-
101
-
102
-
103
-
104
-
105
-
106
-
107
-
108
-
109
-
110
-
111
-
112
-
113
-
114
-
115
-
116
-
117
-
118
-
119
-
120
-
121
-
122
-
123
-
124
-
125
-
126
-
127
-
128
-
129
-
130
-
131
-
132
-
133
-
134
-
135
-
136
-
137
-
138
-
139
-
140
-
141
-
142
-
143
-
144
-
145
-
146
-
147
-
148
-
149
-
150
-
151
-
152
-
153
-
154
-
155
-
156
-
157
-
158
-
159
-
160
-
161
-
162
-
163
-
164
-
165
-
166
-
167
-
168
-
169
-
170
-
171
-
172
-
173
-
174
-
175
-
176
-
177
-
178
-
179
-
180
-
181
-
182
-
183
-
184
-
185
-
186
-
187
-
188
-
189
-
190
-
191
-
192
-
193
-
194
-
195
-
196
-
197
-
198
-
199
-
200
-
201
-
202
-
203
-
204
-
205
-
206
-
207
-
208
-
209
-
210
-
211
-
212
-
213
-
214
-
215
-
216
-
217
-
218
-
219
-
220
-
221
-
222
-
223
-
224
-
225
-
226
-
227
-
228
-
229
-
230
-
231
-
232
-
233
-
234
-
235
-
236
-
237
-
238
-
239
-
240
-
241
-
242
-
243
-
244
-
245
-
246
-
247
-
248
-
249
-
250
-
251
-
252
 |
 |

Risk Management – Credit Risk Management (continued)
Four percent of this portfolio is private label securitizations for
which we originated the loans and therefore have some
repurchase risk. Although we have observed an increase in
outstanding demands, compared to December 31, 2011,
associated with our private label securitizations as some
investors have reviewed defaulted loans for potential breaches of
our loan sale representations and warranties, we continue to
believe the risk of repurchase in our private label securitizations
is substantially reduced, relative to other private label
securitizations, because approximately one-half of this portfolio
of private label securitizations do not contain representations
and warranties regarding borrower or other third party
misrepresentations related to the mortgage loan, general
compliance with underwriting guidelines, or property valuation,
which are commonly asserted bases for repurchase. For this 4%
private label securitization segment of our residential mortgage
loan servicing portfolio (weighted average age of 86 months),
58% are loans from 2005 vintages or earlier; 78% were prime at
origination; and approximately 64% are jumbo loans. The
weighted-average LTV as of December 31, 2012 for this private
securitization segment was 75%. We believe the highest risk
segment of these private label securitizations is the subprime
loans originated in 2006 and 2007. These subprime loans have
seller representations and warranties and currently have LTVs
close to or exceeding 100%, and represent 9% of the private label
securitization portion of the residential mortgage servicing
portfolio. We had $180 million of repurchases related to private
label securitizations in 2012 compared with $110 million in 2011.
Of the servicing portfolio, 4% is non-agency acquired
servicing and 1% is private whole loan sales. We did not
underwrite and securitize the non-agency acquired servicing and
therefore we have no obligation on that portion of our servicing
portfolio to the investor for any repurchase demands arising
from origination practices. For the private whole loan segment,
while we do have repurchase risk on these loans, less than 2%
were subprime at origination and loans that were sold and
subsequently securitized are included in the private label
securitization segment discussed above.
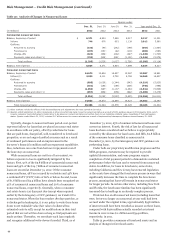
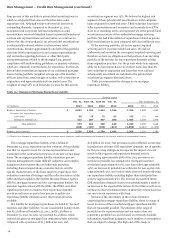
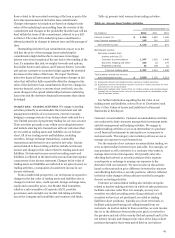
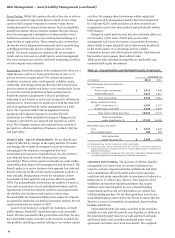
Table 39 summarizes the changes in our mortgage
repurchase liability.
Table 39: Changes in Mortgage Repurchase Liability
Quarter ended
Dec. 31, Sept. 30, June 30, Mar. 31, Year ended Dec. 31,
(in millions) 2012 2012 2012 2012 2012 2011 2010
Balance, beginning of period $ 2,033 1,764 1,444 1,326 1,326 1,289 1,033
Provision for repurchase losses:
Loan sales 66 75 72 62 275 101 144
Change in estimate (1) 313 387 597 368 1,665 1,184 1,474
Total additions 379 462 669 430 1,940 1,285 1,618
Losses (206) (193) (349) (312) (1,060) (1,248) (1,362)
Balance, end of period $ 2,206 2,033 1,764 1,444 2,206 1,326 1,289
(1) Results from changes in investor demand and mortgage insurer practices, credit deterioration and changes in the financial stability of correspondent lenders.
The mortgage repurchase liability of $2.2 billion at
December 31, 2012, represents our best estimate of the probable
loss that we expect to incur for various representations and
warranties in the contractual provisions of our sales of mortgage
loans. The mortgage repurchase liability estimation process
requires management to make difficult, subjective and complex
judgments about matters that are inherently uncertain,
including demand expectations, economic factors, and the
specific characteristics of the loans subject to repurchase. Our
evaluation considers all vintages and the collective actions of the
GSEs and their regulator, the Federal Housing Finance Agency
(FHFA), mortgage insurers and our correspondent lenders. We
maintain regular contact with the GSEs, the FHFA, and other
significant investors to monitor their repurchase demand
practices and issues as part of our process to update our
repurchase liability estimate as new information becomes
available.
Our liability for mortgage repurchases, included in “Accrued
expenses and other liabilities” in our consolidated balance sheet,
was $2.2 billion at December 31, 2012, and $1.3 billion at
December 31, 2011. In 2012, we provided $1.9 billion, which
reduced net gains on mortgage loan origination/sales activities,
compared with a provision of $1.3 billion for 2011 and
$1.6 billion for 2010. Our provision in 2012 reflected an increase
in projections of future GSE repurchase demands, net of appeals,
for the pre-2009 vintages to incorporate the impact of recent
trends in file requests and repurchase demand activity
(comprising approximately 58% of the 2012 provision), an
increase in probable loss estimates for mortgage insurance
rescissions (approximately 10%), new loan sales (approximately
14%), an increase in probable loss estimates for non-agency risk
(approximately 9%), and various other observed trends affecting
our repurchase liability including higher than anticipated loss
severity (approximately 9%). The increase in projected future
GSE repurchase demands in 2012 was predominantly a result of
an increase in the expected file reviews by the GSEs as well as an
increase in observed demand rates on these file reviews based on
our most recent experience with them.
Because of the uncertainty in the various estimates
underlying the mortgage repurchase liability, there is a range of
losses in excess of the recorded mortgage repurchase liability
that are reasonably possible. The estimate of the range of
possible loss for representations and warranties does not
represent a probable loss, and is based on currently available
information, significant judgment, and a number of assumptions
that are subject to change. The high end of this range of
76