Wells Fargo 2012 Annual Report Download - page 47
Download and view the complete annual report
Please find page 47 of the 2012 Wells Fargo annual report below. You can navigate through the pages in the report by either clicking on the pages listed below, or by using the keyword search tool below to find specific information within the annual report.-
 1
1 -
2
-
3
-
4
-
5
-
6
-
7
-
8
-
9
-
10
-
11
-
12
-
13
-
14
-
15
-
16
-
17
-
18
-
19
-
20
-
21
-
22
-
23
-
24
-
25
-
26
-
27
-
28
-
29
-
30
-
31
-
32
-
33
-
34
-
35
-
36
-
 37
37 -
 38
38 -
 39
39 -
 40
40 -
 41
41 -
 42
42 -
 43
43 -
 44
44 -
 45
45 -
 46
46 -
 47
47 -
 48
48 -
 49
49 -
 50
50 -
 51
51 -
 52
52 -
 53
53 -
 54
54 -
 55
55 -
 56
56 -
 57
57 -
58
-
59
-
60
-
61
-
62
-
63
-
64
-
65
-
66
-
67
-
68
-
69
-
70
-
71
-
72
-
73
-
74
-
75
-
76
-
77
-
78
-
79
-
80
-
81
-
82
-
83
-
84
-
85
-
86
-
87
-
88
-
89
-
90
-
91
-
92
-
93
-
94
-
95
-
96
-
97
-
98
-
99
-
100
-
101
-
102
-
103
-
104
-
105
-
106
-
107
-
108
-
109
-
110
-
111
-
112
-
113
-
114
-
115
-
116
-
117
-
118
-
119
-
120
-
121
-
122
-
123
-
124
-
125
-
126
-
127
-
128
-
129
-
130
-
131
-
132
-
133
-
134
-
135
-
136
-
137
-
138
-
139
-
140
-
141
-
142
-
143
-
144
-
145
-
146
-
147
-
148
-
149
-
150
-
151
-
152
-
153
-
154
-
155
-
156
-
157
-
158
-
159
-
160
-
161
-
162
-
163
-
164
-
165
-
166
-
167
-
168
-
169
-
170
-
171
-
172
-
173
-
174
-
175
-
176
-
177
-
178
-
179
-
180
-
181
-
182
-
183
-
184
-
185
-
186
-
187
-
188
-
189
-
190
-
191
-
192
-
193
-
194
-
195
-
196
-
197
-
198
-
199
-
200
-
201
-
202
-
203
-
204
-
205
-
206
-
207
-
208
-
209
-
210
-
211
-
212
-
213
-
214
-
215
-
216
-
217
-
218
-
219
-
220
-
221
-
222
-
223
-
224
-
225
-
226
-
227
-
228
-
229
-
230
-
231
-
232
-
233
-
234
-
235
-
236
-
237
-
238
-
239
-
240
-
241
-
242
-
243
-
244
-
245
-
246
-
247
-
248
-
249
-
250
-
251
-
252
 |
 |

comprehensive wealth management services to ultra high net
worth families and individuals as well as their endowments and
foundations. Brokerage serves customers' advisory, brokerage
and financial needs as part of one of the largest full-service
brokerage firms in the United States. Retirement is a national
leader in providing institutional retirement and trust services
(including 401(k) and pension plan record keeping) for
businesses, retail retirement solutions for individuals, and
reinsurance services for the life insurance industry.
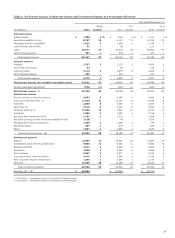
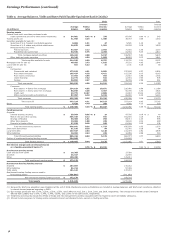
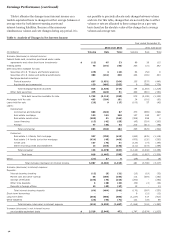
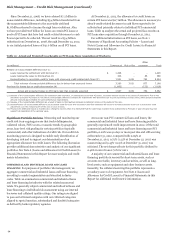
Wealth, Brokerage and Retirement reported net income of
$1.3 billion in 2012, up $47 million, or 4%, from 2011. The prior
year results include the H.D. Vest Financial Services business
that was sold in fourth quarter 2011 at a gain of $153 million.
Revenue of $12.2 billion decreased $17 million from 2011. Net
interest income decreased due to lower interest rates on the loan
and investment portfolios partially offset by the impact of
growth in low-cost core deposits. Average core deposits of
$137.5 billion in 2012 increased 6% from 2011. Noninterest
income increased year over year due to higher asset-based fees
and gains on deferred compensation plan investments (offset in
expense). The increase was partially offset by the 2011 gain on
the sale of H.D. Vest, lower transaction revenue and reduced
securities gains in the brokerage business. Noninterest expense
was flat, including the impact of deferred compensation plan
expense (offset in revenue), for 2012 compared with 2011. The
provision for credit losses decreased $45 million, or 26%, from
2011, due to improved credit quality and lower net charge-offs.
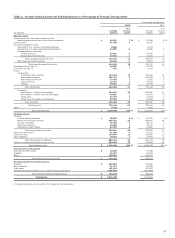
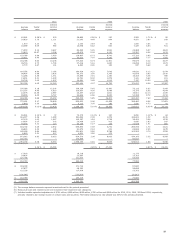
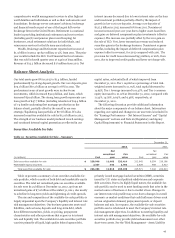
Balance Sheet Analysis
Our total assets grew 8% in 2012 to $1.4 trillion, funded
predominantly by strong deposit growth. Our core deposits grew
$73.1 billion ($67.2 billion on average) or 8% in 2012. The
predominant areas of asset growth were in short-term
investments, which increased $92.9 billion, and loans, which
increased $29.9 billion. The strong loan growth represents core
loan growth of $47.7 billion (including retention of $19.4 billion
of 1-4 family conforming first mortgage production on the
balance sheet), partially offset by the runoff in our non
strategic/liquidating loan portfolio of $17.8 billion. We also
increased securities available for sale by $12.6 billion in 2012.
The strength of our business model produced record earnings
and continued internal capital generation as reflected in our
capital ratios, substantially all of which improved from
December 31, 2011. Tier 1 capital as a percentage of total risk-
weighted assets increased to 11.75%, total capital decreased to
14.63%, Tier 1 leverage increased to 9.47%, and Tier 1 common
equity increased to 10.12% at December 31, 2012, compared with
11.33%, 14.76%, 9.03%, and 9.46%, respectively, at
December 31, 2011.
The following discussion provides additional information
about the major components of our balance sheet. Information
regarding our capital and changes in our asset mix is included in
the “Earnings Performance – Net Interest Income” and “Capital
Management” sections and Note 26 (Regulatory and Agency
Capital Requirements) to Financial Statements in this Report.
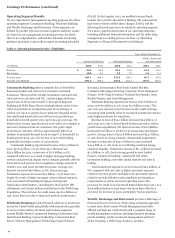
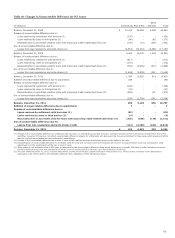
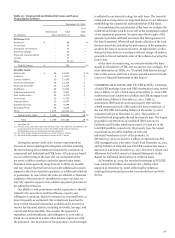
Securities Available for Sale
Table 10: Securities Available for Sale – Summary
December 31,
2012 2011
Net Net
unrealized Fair unrealized Fair
(in millions) Cost gain value Cost gain value
Debt securities available for sale $ 220,946 11,468 232,414 212,642 6,554 219,196
Marketable equity securities 2,337 448 2,785 2,929 488 3,417
Total securities available for sale $ 223,283 11,916 235,199 215,571 7,042 222,613
Table 10 presents a summary of our securities available-for-
sale portfolio, which consists of both debt and marketable equity
securities. The total net unrealized gains on securities available
for sale were $11.9 billion at December 31, 2012, up from net
unrealized gains of $7.0 billion at December 31, 2011, due mostly
to a decline in long-term yields and tightening of credit spreads.
The size and composition of the available-for-sale portfolio is
largely dependent upon the Company’s liquidity and interest rate
risk management objectives. Our business generates assets and
liabilities, such as loans, deposits and long-term debt, which
have different maturities, yields, re-pricing, prepayment
characteristics and other provisions that expose us to interest
rate and liquidity risk. The available-for-sale securities portfolio
consists primarily of liquid, high quality federal agency debt,
privately issued mortgage-backed securities (MBS), securities
issued by U.S. states and political subdivisions and corporate
debt securities. Due to its highly liquid nature, the available-for-
sale portfolio can be used to meet funding needs that arise in the
normal course of business or due to market stress. Changes in
our interest rate risk profile may occur due to changes in overall
economic or market conditions that could influence drivers such
as loan origination demand, prepayment speeds, or deposit
balances and mix. In response, the available-for-sale securities
portfolio can be rebalanced to meet the Company’s interest rate
risk management objectives. In addition to meeting liquidity and
interest rate risk management objectives, the available-for-sale
securities portfolio may provide yield enhancement over other
short-term assets. See the “Risk Management - Asset/Liability
45