Wells Fargo 2012 Annual Report Download - page 234
Download and view the complete annual report
Please find page 234 of the 2012 Wells Fargo annual report below. You can navigate through the pages in the report by either clicking on the pages listed below, or by using the keyword search tool below to find specific information within the annual report.-
 1
1 -
2
-
3
-
4
-
5
-
6
-
7
-
8
-
9
-
10
-
11
-
12
-
13
-
14
-
15
-
16
-
17
-
18
-
19
-
20
-
21
-
22
-
23
-
24
-
25
-
26
-
27
-
28
-
29
-
30
-
31
-
32
-
33
-
34
-
35
-
36
-
37
-
38
-
39
-
40
-
41
-
42
-
43
-
44
-
45
-
46
-
47
-
48
-
49
-
50
-
51
-
52
-
53
-
54
-
55
-
56
-
57
-
58
-
59
-
60
-
61
-
62
-
63
-
64
-
65
-
66
-
67
-
68
-
69
-
70
-
71
-
72
-
73
-
74
-
75
-
76
-
77
-
78
-
79
-
80
-
81
-
82
-
83
-
84
-
85
-
86
-
87
-
88
-
89
-
90
-
91
-
92
-
93
-
94
-
95
-
96
-
97
-
98
-
99
-
100
-
101
-
102
-
103
-
104
-
105
-
106
-
107
-
108
-
109
-
110
-
111
-
112
-
113
-
114
-
115
-
116
-
117
-
118
-
119
-
120
-
121
-
122
-
123
-
124
-
125
-
126
-
127
-
128
-
129
-
130
-
131
-
132
-
133
-
134
-
135
-
136
-
137
-
138
-
139
-
140
-
141
-
142
-
143
-
144
-
145
-
146
-
147
-
148
-
149
-
150
-
151
-
152
-
153
-
154
-
155
-
156
-
157
-
158
-
159
-
160
-
161
-
162
-
163
-
164
-
165
-
166
-
167
-
168
-
169
-
170
-
171
-
172
-
173
-
174
-
175
-
176
-
177
-
178
-
179
-
180
-
181
-
182
-
183
-
184
-
185
-
186
-
187
-
188
-
189
-
190
-
191
-
192
-
193
-
194
-
195
-
196
-
197
-
198
-
199
-
200
-
201
-
202
-
203
-
204
-
205
-
206
-
207
-
208
-
209
-
210
-
211
-
212
-
213
-
214
-
215
-
216
-
217
-
218
-
219
-
220
-
221
-
222
-
223
-
 224
224 -
 225
225 -
 226
226 -
 227
227 -
 228
228 -
 229
229 -
 230
230 -
 231
231 -
 232
232 -
 233
233 -
 234
234 -
 235
235 -
 236
236 -
 237
237 -
 238
238 -
 239
239 -
 240
240 -
 241
241 -
 242
242 -
 243
243 -
 244
244 -
245
-
246
-
247
-
248
-
249
-
250
-
251
-
252
 |
 |

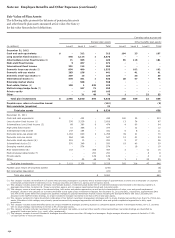
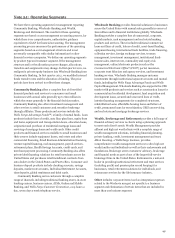
Note 20: Employee Benefits and Other Expenses (continued)
party appraisers. Market values are estimates and the actual
market price of the real estate can only be determined by
negotiation between independent third parties in a sales
transaction. This group of assets also includes investments in
exchange-traded equity securities described above.
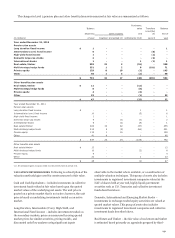
Multi-Strategy Hedge Funds and Private Equity – the fair values
of hedge funds are valued based on the proportionate share of
the underlying net assets of the investment funds that comprise
the fund, based on valuations supplied by the underlying
investment funds. Investments in private equity funds are valued
at the NAV provided by the fund sponsor. Market values are
estimates and the actual market price of the investments can
only be determined by negotiation between independent third
parties in a sales transaction.
Other – the fair values of miscellaneous investments are valued
at the NAV provided by the fund sponsor. Market values are
estimates and the actual market price of the investments can
only be determined by negotiation between independent third
parties in a sales transaction. This group of assets also includes
insurance contracts that are generally stated at cash surrender
value.
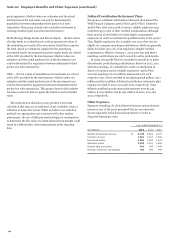
The methods described above may produce a fair value
calculation that may not be indicative of net realizable value or
reflective of future fair values. While we believe our valuation
methods are appropriate and consistent with other market
participants, the use of different methodologies or assumptions
to determine the fair value of certain financial instruments could
result in a different fair value measurement at the reporting
date.
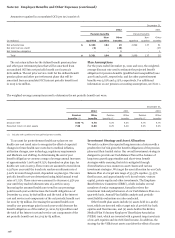
Defined Contribution Retirement Plans
We sponsor a defined contribution retirement plan named the
Wells Fargo & Company 401(k) Plan (401(k) Plan). Under the
401(k) Plan, after one month of service, eligible employees may
contribute up to 50% of their certified compensation, although
there may be a lower limit for certain highly compensated
employees in order to maintain the qualified status of the 401(k)
Plan. Eligible employees who complete one year of service are
eligible for company matching contributions, which are generally
dollar for dollar up to 6% of an employee's eligible certified
compensation. Effective January 1, 2010, previous and future
matching contributions are 100% vested for active participants.
In 2009, the 401(k) Plan was amended to permit us to make
discretionary profit sharing contributions. Based on 2012, 2011
and 2010 earnings, we committed to make a contribution in
shares of common stock to eligible employees’ 401(k) Plan
accounts equaling 2% of certified compensation for each
respective year, which resulted in recognizing $318 million, $311
million and $316 million of defined contribution retirement plan
expense recorded in 2012, 2011 and 2010, respectively. Total
defined contribution retirement plan expenses were $1,143
million, $1,104 million and $1,092 million in 2012, 2011 and
2010, respectively.
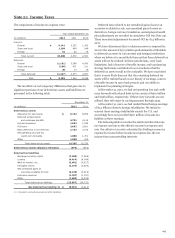
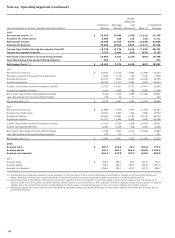
Other Expenses
Expenses exceeding 1% of total interest income and noninterest
income in any of the years presented that are not otherwise
shown separately in the financial statements or Notes to
Financial Statements were:
Year ended December 31,
(in millions) 2012 2011 2010
Outside professional services $ 2,729 2,692 2,370
Contract services 1,011 1,407 1,642
Foreclosed assets 1,061 1,354 1,537
Operating losses 2,235 1,261 1,258
Outside data processing 910 935 1,046
Postage, stationery and supplies 799 942 944
232