Wells Fargo 2012 Annual Report Download - page 204
Download and view the complete annual report
Please find page 204 of the 2012 Wells Fargo annual report below. You can navigate through the pages in the report by either clicking on the pages listed below, or by using the keyword search tool below to find specific information within the annual report.-
 1
1 -
2
-
3
-
4
-
5
-
6
-
7
-
8
-
9
-
10
-
11
-
12
-
13
-
14
-
15
-
16
-
17
-
18
-
19
-
20
-
21
-
22
-
23
-
24
-
25
-
26
-
27
-
28
-
29
-
30
-
31
-
32
-
33
-
34
-
35
-
36
-
37
-
38
-
39
-
40
-
41
-
42
-
43
-
44
-
45
-
46
-
47
-
48
-
49
-
50
-
51
-
52
-
53
-
54
-
55
-
56
-
57
-
58
-
59
-
60
-
61
-
62
-
63
-
64
-
65
-
66
-
67
-
68
-
69
-
70
-
71
-
72
-
73
-
74
-
75
-
76
-
77
-
78
-
79
-
80
-
81
-
82
-
83
-
84
-
85
-
86
-
87
-
88
-
89
-
90
-
91
-
92
-
93
-
94
-
95
-
96
-
97
-
98
-
99
-
100
-
101
-
102
-
103
-
104
-
105
-
106
-
107
-
108
-
109
-
110
-
111
-
112
-
113
-
114
-
115
-
116
-
117
-
118
-
119
-
120
-
121
-
122
-
123
-
124
-
125
-
126
-
127
-
128
-
129
-
130
-
131
-
132
-
133
-
134
-
135
-
136
-
137
-
138
-
139
-
140
-
141
-
142
-
143
-
144
-
145
-
146
-
147
-
148
-
149
-
150
-
151
-
152
-
153
-
154
-
155
-
156
-
157
-
158
-
159
-
160
-
161
-
162
-
163
-
164
-
165
-
166
-
167
-
168
-
169
-
170
-
171
-
172
-
173
-
174
-
175
-
176
-
177
-
178
-
179
-
180
-
181
-
182
-
183
-
184
-
185
-
186
-
187
-
188
-
189
-
190
-
191
-
192
-
193
-
 194
194 -
 195
195 -
 196
196 -
 197
197 -
 198
198 -
 199
199 -
 200
200 -
 201
201 -
 202
202 -
 203
203 -
 204
204 -
 205
205 -
 206
206 -
 207
207 -
 208
208 -
 209
209 -
 210
210 -
 211
211 -
 212
212 -
 213
213 -
 214
214 -
215
-
216
-
217
-
218
-
219
-
220
-
221
-
222
-
223
-
224
-
225
-
226
-
227
-
228
-
229
-
230
-
231
-
232
-
233
-
234
-
235
-
236
-
237
-
238
-
239
-
240
-
241
-
242
-
243
-
244
-
245
-
246
-
247
-
248
-
249
-
250
-
251
-
252
 |
 |
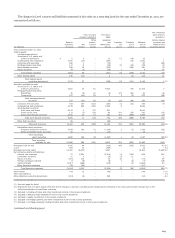
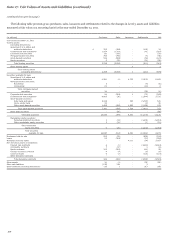
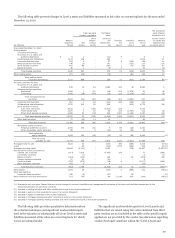
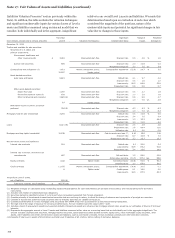
Note 17: Fair Values of Assets and Liabilities (continued)
qualitative assessments of the viability of the investee, evaluation
of the financial statements of the investee and prospects for its
future. Public equity investments are valued using quoted
market prices and discounts are only applied when there are
trading restrictions that are an attribute of the investment. We
estimate the fair value of investments in non-public securities
using metrics such as security prices of comparable public
companies, acquisition prices for similar companies and original
investment purchase price multiples, while also incorporating a
portfolio company's financial performance and specific factors.
For investments in private equity funds, we use the NAV
provided by the fund sponsor as an appropriate measure of fair
value. In some cases, such NAVs require adjustments based on
certain unobservable inputs.
Liabilities
DEPOSIT LIABILITIES
Deposit liabilities are carried at historical
cost. The fair value of deposits with no stated maturity, such as
noninterest-bearing demand deposits, interest-bearing checking,
and market rate and other savings, is equal to the amount
payable on demand at the measurement date. The fair value of
other time deposits is calculated based on the discounted value
of contractual cash flows. The discount rate is estimated using
the rates currently offered for like wholesale deposits with
similar remaining maturities.
SHORT-TERM FINANCIAL LIABILITIES Short-term financial
liabilities are carried at historical cost and include federal funds
purchased and securities sold under repurchase agreements,
commercial paper and other short-term borrowings. The
carrying amount is a reasonable estimate of fair value because of
the relatively short time between the origination of the
instrument and its expected realization.
OTHER LIABILITIES Other liabilities recorded at fair value on a
recurring basis, excluding derivative liabilities (see the
“Derivatives” section for derivative liabilities), includes primarily
short sale liabilities. Short sale liabilities are predominantly
classified as either Level 1 or Level 2, generally dependent upon
whether the underlying securities have readily obtainable quoted
prices in active exchange markets.
LONG-TERM DEBT Long-term debt is generally carried at
amortized cost. For disclosure, we are required to estimate the
fair value of long-term debt. Generally, the discounted cash flow
method is used to estimate the fair value of our long-term debt.
Contractual cash flows are discounted using rates currently
offered for new notes with similar remaining maturities and, as
such, these discount rates include our current spread levels.
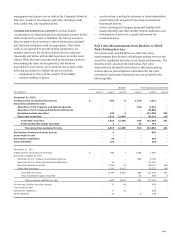
Level 3 Asset and Liability Valuation Processes
We generally determine fair value of our Level 3 assets and
liabilities by using internally developed models and, to a lesser
extent, prices obtained from third-party pricing services or
brokers (collectively, vendors). Our valuation processes vary
depending on which approach is utilized.
INTERNAL MODEL VALUATIONS Our internally developed
models primarily consist of discounted cash flow techniques. Use
of such techniques requires determining relevant inputs, some of
which are unobservable. Unobservable inputs are generally
derived from historic performance of similar assets or
determined from previous market trades in similar instruments.
These unobservable inputs usually consist of discount rates,
default rates, loss severity upon default, volatilities, correlations
and prepayment rates, which are inherent within our Level 3
instruments. Such inputs can be correlated to similar portfolios
with known historic experience or recent trades where particular
unobservable inputs may be implied; but due to the nature of
various inputs being reflected within a particular trade, the value
of each input is considered unobservable. We attempt to
correlate each unobservable input to historic experience and
other third party data where available.
Internal valuation models are subject to review prescribed
within our model risk management policies and procedures
which includes model validation. The purpose of model
validation includes ensuring the model is appropriate for its
intended use and the appropriate controls exist to help mitigate
risk of invalid valuations. Model validation assesses the
adequacy and appropriateness of the model, including reviewing
its key components such as inputs, processing components, logic
or theory, output results and supporting model documentation.
Validation also includes ensuring significant unobservable
model inputs are appropriate given observable market
transactions or other market data within the same or similar
asset classes. This ensures modeled approaches are appropriate
given similar product valuation techniques and are in line with
their intended purpose.
We have ongoing monitoring procedures in place for our
Level 3 assets and liabilities that use such internal valuation
models. These procedures, which are designed to provide
reasonable assurance that models continue to perform as
expected after approved, include:
ongoing analysis and benchmarking to market transactions
and other independent market data (including pricing
vendors, if available);
back-testing of modeled fair values to actual realized
transactions; and
review of modeled valuation results against expectations,
including review of significant or unusual value fluctuations.
We update model inputs and methodologies periodically to
reflect these monitoring procedures. Additionally, procedures
and controls are in place to ensure existing models are subject to
periodic reviews, and we perform full model revalidations as
necessary.
All internal valuation models are subject to ongoing review
by business-unit-level management. More complex models are
subject to additional oversight by a corporate-level risk
management department. Corporate oversight responsibilities
include evaluating adequacy of business unit risk management
programs, maintaining company-wide model validation policies
and standards and reporting the results of these activities to
management and our Enterprise Risk Management Committee
(ERMC). The ERMC, which consists of senior executive
202