Wells Fargo 2012 Annual Report Download - page 165
Download and view the complete annual report
Please find page 165 of the 2012 Wells Fargo annual report below. You can navigate through the pages in the report by either clicking on the pages listed below, or by using the keyword search tool below to find specific information within the annual report.-
 1
1 -
2
-
3
-
4
-
5
-
6
-
7
-
8
-
9
-
10
-
11
-
12
-
13
-
14
-
15
-
16
-
17
-
18
-
19
-
20
-
21
-
22
-
23
-
24
-
25
-
26
-
27
-
28
-
29
-
30
-
31
-
32
-
33
-
34
-
35
-
36
-
37
-
38
-
39
-
40
-
41
-
42
-
43
-
44
-
45
-
46
-
47
-
48
-
49
-
50
-
51
-
52
-
53
-
54
-
55
-
56
-
57
-
58
-
59
-
60
-
61
-
62
-
63
-
64
-
65
-
66
-
67
-
68
-
69
-
70
-
71
-
72
-
73
-
74
-
75
-
76
-
77
-
78
-
79
-
80
-
81
-
82
-
83
-
84
-
85
-
86
-
87
-
88
-
89
-
90
-
91
-
92
-
93
-
94
-
95
-
96
-
97
-
98
-
99
-
100
-
101
-
102
-
103
-
104
-
105
-
106
-
107
-
108
-
109
-
110
-
111
-
112
-
113
-
114
-
115
-
116
-
117
-
118
-
119
-
120
-
121
-
122
-
123
-
124
-
125
-
126
-
127
-
128
-
129
-
130
-
131
-
132
-
133
-
134
-
135
-
136
-
137
-
138
-
139
-
140
-
141
-
142
-
143
-
144
-
145
-
146
-
147
-
148
-
149
-
150
-
151
-
152
-
153
-
154
-
 155
155 -
 156
156 -
 157
157 -
 158
158 -
 159
159 -
 160
160 -
 161
161 -
 162
162 -
 163
163 -
 164
164 -
 165
165 -
 166
166 -
 167
167 -
 168
168 -
 169
169 -
 170
170 -
 171
171 -
 172
172 -
 173
173 -
 174
174 -
 175
175 -
176
-
177
-
178
-
179
-
180
-
181
-
182
-
183
-
184
-
185
-
186
-
187
-
188
-
189
-
190
-
191
-
192
-
193
-
194
-
195
-
196
-
197
-
198
-
199
-
200
-
201
-
202
-
203
-
204
-
205
-
206
-
207
-
208
-
209
-
210
-
211
-
212
-
213
-
214
-
215
-
216
-
217
-
218
-
219
-
220
-
221
-
222
-
223
-
224
-
225
-
226
-
227
-
228
-
229
-
230
-
231
-
232
-
233
-
234
-
235
-
236
-
237
-
238
-
239
-
240
-
241
-
242
-
243
-
244
-
245
-
246
-
247
-
248
-
249
-
250
-
251
-
252
 |
 |

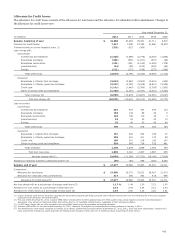
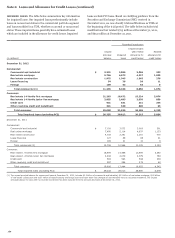
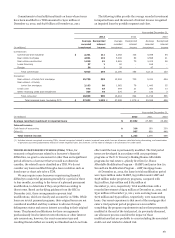
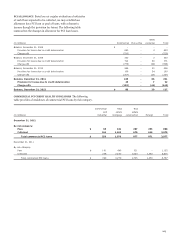
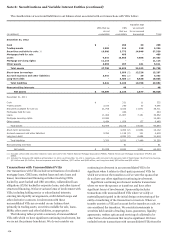
The table below summarizes permanent modification TDRs
that have defaulted in the current period within 12 months of
their permanent modification date. We are reporting these
defaulted TDRs based on a payment default definition of 90 days
past due for the commercial portfolio segment and 60 days past
due for the consumer portfolio segment.
Recorded
investment of defaults
Year ended December 31,
(in millions) 2012 2011
Commercial:
Commercial and industrial $ 379 216
Real estate mortgage 579 331
Real estate construction 261 69
Lease financing 1 1
Foreign - 1
Total commercial 1,220 618
Consumer:
Real estate 1-4 family first mortgage 567 1,110
Real estate 1-4 family junior lien mortgage 55 137
Credit card 94 156
Other revolving credit and installment 56 113
Total consumer 772 1,516
Total $ 1,992 2,134
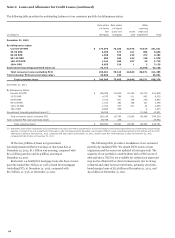
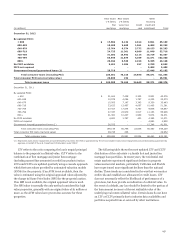
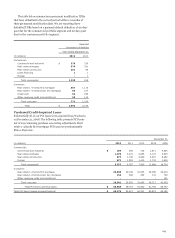
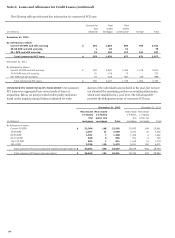
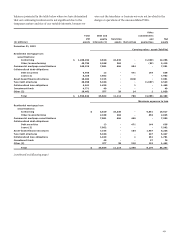
Purchased Credit-Impaired Loans
Substantially all of our PCI loans were acquired from Wachovia
on December 31, 2008. The following table presents PCI loans
net of any remaining purchase accounting adjustments. Real
estate 1-4 family first mortgage PCI loans are predominantly
Pick-a-Pay loans.
December 31,
(in millions) 2012 2011 2010 2009 2008
Commercial:
Commercial and industrial $ 259 399 718 1,911 4,580
Real estate mortgage 1,970 3,270 2,855 4,137 5,803
Real estate construction 877 1,745 2,949 5,207 6,462
Foreign 871 1,353 1,413 1,733 1,859
Total commercial 3,977 6,767 7,935 12,988 18,704
Consumer:
Real estate 1-4 family first mortgage 26,839 29,746 33,245 38,386 39,214
Real estate 1-4 family junior lien mortgage 152 206 250 331 728
Other revolving credit and installment - - - - 151
Total consumer 26,991 29,952 33,495 38,717 40,093
Total PCI loans (carrying value) $ 30,968 36,719 41,430 51,705 58,797
Total PCI loans (unpaid principal balance) $ 45,174 55,312 64,331 83,615 98,182
163