Wells Fargo 2012 Annual Report Download - page 220
Download and view the complete annual report
Please find page 220 of the 2012 Wells Fargo annual report below. You can navigate through the pages in the report by either clicking on the pages listed below, or by using the keyword search tool below to find specific information within the annual report.-
 1
1 -
2
-
3
-
4
-
5
-
6
-
7
-
8
-
9
-
10
-
11
-
12
-
13
-
14
-
15
-
16
-
17
-
18
-
19
-
20
-
21
-
22
-
23
-
24
-
25
-
26
-
27
-
28
-
29
-
30
-
31
-
32
-
33
-
34
-
35
-
36
-
37
-
38
-
39
-
40
-
41
-
42
-
43
-
44
-
45
-
46
-
47
-
48
-
49
-
50
-
51
-
52
-
53
-
54
-
55
-
56
-
57
-
58
-
59
-
60
-
61
-
62
-
63
-
64
-
65
-
66
-
67
-
68
-
69
-
70
-
71
-
72
-
73
-
74
-
75
-
76
-
77
-
78
-
79
-
80
-
81
-
82
-
83
-
84
-
85
-
86
-
87
-
88
-
89
-
90
-
91
-
92
-
93
-
94
-
95
-
96
-
97
-
98
-
99
-
100
-
101
-
102
-
103
-
104
-
105
-
106
-
107
-
108
-
109
-
110
-
111
-
112
-
113
-
114
-
115
-
116
-
117
-
118
-
119
-
120
-
121
-
122
-
123
-
124
-
125
-
126
-
127
-
128
-
129
-
130
-
131
-
132
-
133
-
134
-
135
-
136
-
137
-
138
-
139
-
140
-
141
-
142
-
143
-
144
-
145
-
146
-
147
-
148
-
149
-
150
-
151
-
152
-
153
-
154
-
155
-
156
-
157
-
158
-
159
-
160
-
161
-
162
-
163
-
164
-
165
-
166
-
167
-
168
-
169
-
170
-
171
-
172
-
173
-
174
-
175
-
176
-
177
-
178
-
179
-
180
-
181
-
182
-
183
-
184
-
185
-
186
-
187
-
188
-
189
-
190
-
191
-
192
-
193
-
194
-
195
-
196
-
197
-
198
-
199
-
200
-
201
-
202
-
203
-
204
-
205
-
206
-
207
-
208
-
209
-
 210
210 -
 211
211 -
 212
212 -
 213
213 -
 214
214 -
 215
215 -
 216
216 -
 217
217 -
 218
218 -
 219
219 -
 220
220 -
 221
221 -
 222
222 -
 223
223 -
 224
224 -
 225
225 -
 226
226 -
 227
227 -
 228
228 -
 229
229 -
 230
230 -
231
-
232
-
233
-
234
-
235
-
236
-
237
-
238
-
239
-
240
-
241
-
242
-
243
-
244
-
245
-
246
-
247
-
248
-
249
-
250
-
251
-
252
 |
 |

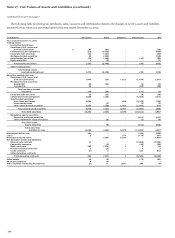
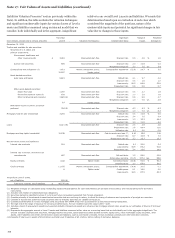
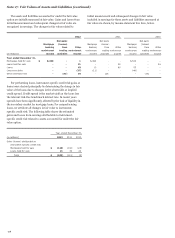
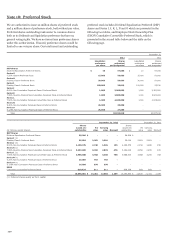
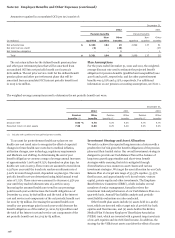
Note 17: Fair Values of Assets and Liabilities (continued)
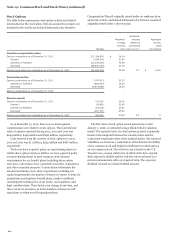
The assets and liabilities accounted for under the fair value
option are initially measured at fair value. Gains and losses from
initial measurement and subsequent changes in fair value are
recognized in earnings. The changes in fair value related to
initial measurement and subsequent changes in fair value
included in earnings for these assets and liabilities measured at
fair value are shown, by income statement line item, below.
2012 2011 2010
Net gains Net gains Net gains
Mortgage (losses) Mortgage (losses) Mortgage (losses)
banking from Other banking from Other banking from Other
noninterest trading noninterest noninterest trading noninterest noninterest trading noninterest
(in millions) income activities income income activities income income activities income
Year ended December 31,
Mortgages held for sale $ 8,240 - 1 6,084 - - 6,512 - -
Loans held for sale - - 21 - - 32 - - 24
Loans - - 63 13 - 80 55 - -
Long-term debt - - (27) (11) - - (48) - -
Other interests held - (42) 34 - (25) - - (13) -
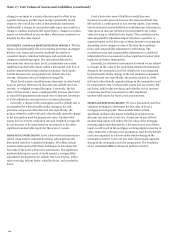
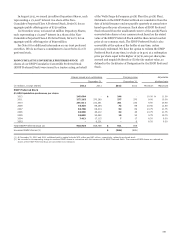
For performing loans, instrument-specific credit risk gains or
losses were derived principally by determining the change in fair
value of the loans due to changes in the observable or implied
credit spread. Credit spread is the market yield on the loans less
the relevant risk-free benchmark interest rate. In recent years
spreads have been significantly affected by the lack of liquidity in
the secondary market for mortgage loans. For nonperforming
loans, we attribute all changes in fair value to instrument-
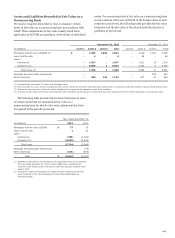
specific credit risk. The following table shows the estimated
gains and losses from earnings attributable to instrument-
specific credit risk related to assets accounted for under the fair
value option.
Year ended December 31,
(in millions) 2012 2011 2010
Gains (losses) attributable to
instrument-specific credit risk:
Mortgages held for sale $ (124) (144) (28)
Loans held for sale 21 32 24
Total $ (103) (112) (4)
218