Wells Fargo 2012 Annual Report Download - page 184
Download and view the complete annual report
Please find page 184 of the 2012 Wells Fargo annual report below. You can navigate through the pages in the report by either clicking on the pages listed below, or by using the keyword search tool below to find specific information within the annual report.-
 1
1 -
2
-
3
-
4
-
5
-
6
-
7
-
8
-
9
-
10
-
11
-
12
-
13
-
14
-
15
-
16
-
17
-
18
-
19
-
20
-
21
-
22
-
23
-
24
-
25
-
26
-
27
-
28
-
29
-
30
-
31
-
32
-
33
-
34
-
35
-
36
-
37
-
38
-
39
-
40
-
41
-
42
-
43
-
44
-
45
-
46
-
47
-
48
-
49
-
50
-
51
-
52
-
53
-
54
-
55
-
56
-
57
-
58
-
59
-
60
-
61
-
62
-
63
-
64
-
65
-
66
-
67
-
68
-
69
-
70
-
71
-
72
-
73
-
74
-
75
-
76
-
77
-
78
-
79
-
80
-
81
-
82
-
83
-
84
-
85
-
86
-
87
-
88
-
89
-
90
-
91
-
92
-
93
-
94
-
95
-
96
-
97
-
98
-
99
-
100
-
101
-
102
-
103
-
104
-
105
-
106
-
107
-
108
-
109
-
110
-
111
-
112
-
113
-
114
-
115
-
116
-
117
-
118
-
119
-
120
-
121
-
122
-
123
-
124
-
125
-
126
-
127
-
128
-
129
-
130
-
131
-
132
-
133
-
134
-
135
-
136
-
137
-
138
-
139
-
140
-
141
-
142
-
143
-
144
-
145
-
146
-
147
-
148
-
149
-
150
-
151
-
152
-
153
-
154
-
155
-
156
-
157
-
158
-
159
-
160
-
161
-
162
-
163
-
164
-
165
-
166
-
167
-
168
-
169
-
170
-
171
-
172
-
173
-
 174
174 -
 175
175 -
 176
176 -
 177
177 -
 178
178 -
 179
179 -
 180
180 -
 181
181 -
 182
182 -
 183
183 -
 184
184 -
 185
185 -
 186
186 -
 187
187 -
 188
188 -
 189
189 -
 190
190 -
 191
191 -
 192
192 -
 193
193 -
 194
194 -
195
-
196
-
197
-
198
-
199
-
200
-
201
-
202
-
203
-
204
-
205
-
206
-
207
-
208
-
209
-
210
-
211
-
212
-
213
-
214
-
215
-
216
-
217
-
218
-
219
-
220
-
221
-
222
-
223
-
224
-
225
-
226
-
227
-
228
-
229
-
230
-
231
-
232
-
233
-
234
-
235
-
236
-
237
-
238
-
239
-
240
-
241
-
242
-
243
-
244
-
245
-
246
-
247
-
248
-
249
-
250
-
251
-
252
 |
 |

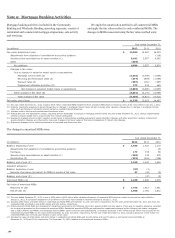
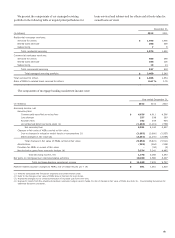
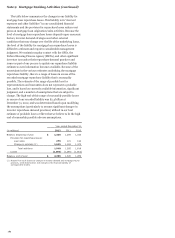
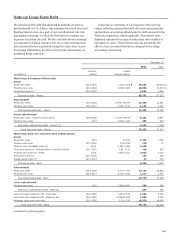
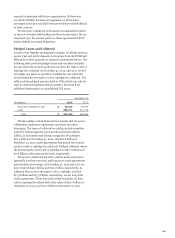
Note 9: Mortgage Banking Activities (continued)
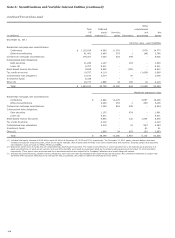
The table below summarizes the changes in our liability for
mortgage loan repurchase losses. This liability is in “Accrued
expenses and other liabilities” in our consolidated financial
statements and the provision for repurchase losses reduces net
gains on mortgage loan origination/sales activities. Because the
level of mortgage loan repurchase losses depends upon economic
factors, investor demand strategies and other external
conditions that may change over the life of the underlying loans,
the level of the liability for mortgage loan repurchase losses is
difficult to estimate and requires considerable management
judgment. We maintain regular contact with the GSEs, the
Federal Housing Finance Agency (FHFA), and other significant
investors to monitor their repurchase demand practices and
issues as part of our process to update our repurchase liability
estimate as new information becomes available. Because of the
uncertainty in the various estimates underlying the mortgage
repurchase liability, there is a range of losses in excess of the
recorded mortgage repurchase liability that is reasonably
possible. The estimate of the range of possible loss for
representations and warranties does not represent a probable
loss, and is based on currently available information, significant
judgment, and a number of assumptions that are subject to
change. The high end of this range of reasonably possible losses
in excess of our recorded liability was $2.4 billion at
December 31, 2012, and was determined based upon modifying
the assumptions (particularly to assume significant changes in
investor repurchase demand practices) utilized in our best
estimate of probable loss to reflect what we believe to be the high
end of reasonably possible adverse assumptions.
Year ended December 31,
(in millions) 2012 2011 2010
Balance, beginning of year $ 1,326 1,289 1,033
Provision for repurchase losses:
Loan sales 275 101 144
Change in estimate (1) 1,665 1,184 1,474
Total additions 1,940 1,285 1,618
Losses (1,060) (1,248) (1,362)
Balance, end of year $ 2,206 1,326 1,289
(1) Results from such factors as changes in investor demand and mortgage insurer
practices, credit deterioration and changes in the financial stability of
correspondent lenders.
182