Wells Fargo 2012 Annual Report Download - page 219
Download and view the complete annual report
Please find page 219 of the 2012 Wells Fargo annual report below. You can navigate through the pages in the report by either clicking on the pages listed below, or by using the keyword search tool below to find specific information within the annual report.-
 1
1 -
2
-
3
-
4
-
5
-
6
-
7
-
8
-
9
-
10
-
11
-
12
-
13
-
14
-
15
-
16
-
17
-
18
-
19
-
20
-
21
-
22
-
23
-
24
-
25
-
26
-
27
-
28
-
29
-
30
-
31
-
32
-
33
-
34
-
35
-
36
-
37
-
38
-
39
-
40
-
41
-
42
-
43
-
44
-
45
-
46
-
47
-
48
-
49
-
50
-
51
-
52
-
53
-
54
-
55
-
56
-
57
-
58
-
59
-
60
-
61
-
62
-
63
-
64
-
65
-
66
-
67
-
68
-
69
-
70
-
71
-
72
-
73
-
74
-
75
-
76
-
77
-
78
-
79
-
80
-
81
-
82
-
83
-
84
-
85
-
86
-
87
-
88
-
89
-
90
-
91
-
92
-
93
-
94
-
95
-
96
-
97
-
98
-
99
-
100
-
101
-
102
-
103
-
104
-
105
-
106
-
107
-
108
-
109
-
110
-
111
-
112
-
113
-
114
-
115
-
116
-
117
-
118
-
119
-
120
-
121
-
122
-
123
-
124
-
125
-
126
-
127
-
128
-
129
-
130
-
131
-
132
-
133
-
134
-
135
-
136
-
137
-
138
-
139
-
140
-
141
-
142
-
143
-
144
-
145
-
146
-
147
-
148
-
149
-
150
-
151
-
152
-
153
-
154
-
155
-
156
-
157
-
158
-
159
-
160
-
161
-
162
-
163
-
164
-
165
-
166
-
167
-
168
-
169
-
170
-
171
-
172
-
173
-
174
-
175
-
176
-
177
-
178
-
179
-
180
-
181
-
182
-
183
-
184
-
185
-
186
-
187
-
188
-
189
-
190
-
191
-
192
-
193
-
194
-
195
-
196
-
197
-
198
-
199
-
200
-
201
-
202
-
203
-
204
-
205
-
206
-
207
-
208
-
 209
209 -
 210
210 -
 211
211 -
 212
212 -
 213
213 -
 214
214 -
 215
215 -
 216
216 -
 217
217 -
 218
218 -
 219
219 -
 220
220 -
 221
221 -
 222
222 -
 223
223 -
 224
224 -
 225
225 -
 226
226 -
 227
227 -
 228
228 -
 229
229 -
230
-
231
-
232
-
233
-
234
-
235
-
236
-
237
-
238
-
239
-
240
-
241
-
242
-
243
-
244
-
245
-
246
-
247
-
248
-
249
-
250
-
251
-
252
 |
 |

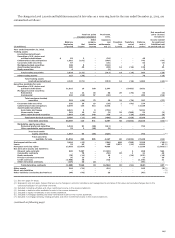
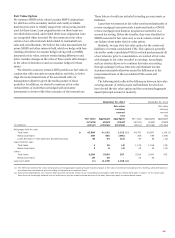
Fair Value Option
We measure MHFS at fair value for prime MHFS originations
for which an active secondary market and readily available
market prices exist to reliably support fair value pricing models
used for these loans. Loan origination fees on these loans are
recorded when earned, and related direct loan origination costs
are recognized when incurred. We also measure at fair value
certain of our other interests held related to residential loan
sales and securitizations. We believe fair value measurement for
prime MHFS and other interests held, which we hedge with free-
standing derivatives (economic hedges) along with our MSRs
measured at fair value, reduces certain timing differences and
better matches changes in the value of these assets with changes
in the value of derivatives used as economic hedges for these
assets.
We elected to measure certain LHFS portfolios at fair value in
conjunction with customer accommodation activities, to better
align the measurement basis of the assets held with our
management objectives given the trading nature of these
portfolios. In addition, we elected to measure at fair value
certain letters of credit that are hedged with derivative
instruments to better reflect the economics of the transactions.
These letters of credit are included in trading account assets or
liabilities.
Loans that we measure at fair value consist predominantly of
reverse mortgage loans previously transferred under a GNMA
reverse mortgage securitization program accounted for as a
secured borrowing. Before the transfer, they were classified as
MHFS measured at fair value and, as such, remain carried on
our balance sheet under the fair value option.
Similarly, we may elect fair value option for the assets and
liabilities of certain consolidated VIEs. This option is generally
elected for newly consolidated VIEs for which predominantly all
of our interests, prior to consolidation, are carried at fair value
with changes in fair value recorded to earnings. Accordingly,
such an election allows us to continue fair value accounting
through earnings for those interests and eliminate income
statement mismatch otherwise caused by differences in the
measurement basis of the consolidated VIEs assets and
liabilities.
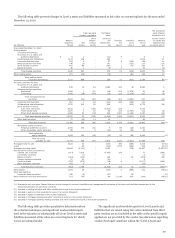
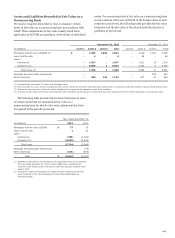
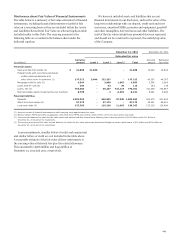
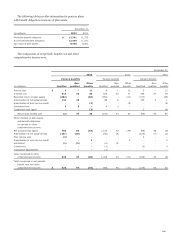
The following table reflects the differences between fair value
carrying amount of certain assets and liabilities for which we
have elected the fair value option and the contractual aggregate
unpaid principal amount at maturity.
December 31, 2012 December 31, 2011
Fair value Fair value
carrying carrying
amount amount
less less
Fair value Aggregate aggregate Fair value Aggregate aggregate
carrying unpaid unpaid carrying unpaid unpaid
(in millions) amount principal principal amount principal principal
Mortgages held for sale:
Total loans $ 42,305 41,183 1,122 (1) 44,791 43,687 1,104 (1)
Nonaccrual loans 309 655 (346) 265 584 (319)
Loans 90 days or more past due and still accruing 49 64 (15) 44 56 (12)
Loans held for sale:
Total loans 6 10 (4) 1,176 1,216 (40)
Nonaccrual loans 2 6 (4) 25 39 (14)
Loans:
Total loans 6,206 5,669 537 5,916 5,441 475
Nonaccrual loans 89 89 - 32 32 -
Long-term debt (1) (1,157) 1,156 (2) - - -
(1) The difference between fair value carrying amount and aggregate unpaid principal includes changes in fair value recorded at and subsequent to funding, gains and losses on
the related loan commitment prior to funding, and premiums on acquired loans.
(2) Represents collateralized, non-recourse debt securities issued by certain of our consolidated securitization VIEs that are held by third party investors. To the extent cash
flows from the underlying collateral are not sufficient to pay the unpaid principal amount of the debt, those third party investors absorb losses.
217