Wells Fargo 2012 Annual Report Download - page 200
Download and view the complete annual report
Please find page 200 of the 2012 Wells Fargo annual report below. You can navigate through the pages in the report by either clicking on the pages listed below, or by using the keyword search tool below to find specific information within the annual report.-
 1
1 -
2
-
3
-
4
-
5
-
6
-
7
-
8
-
9
-
10
-
11
-
12
-
13
-
14
-
15
-
16
-
17
-
18
-
19
-
20
-
21
-
22
-
23
-
24
-
25
-
26
-
27
-
28
-
29
-
30
-
31
-
32
-
33
-
34
-
35
-
36
-
37
-
38
-
39
-
40
-
41
-
42
-
43
-
44
-
45
-
46
-
47
-
48
-
49
-
50
-
51
-
52
-
53
-
54
-
55
-
56
-
57
-
58
-
59
-
60
-
61
-
62
-
63
-
64
-
65
-
66
-
67
-
68
-
69
-
70
-
71
-
72
-
73
-
74
-
75
-
76
-
77
-
78
-
79
-
80
-
81
-
82
-
83
-
84
-
85
-
86
-
87
-
88
-
89
-
90
-
91
-
92
-
93
-
94
-
95
-
96
-
97
-
98
-
99
-
100
-
101
-
102
-
103
-
104
-
105
-
106
-
107
-
108
-
109
-
110
-
111
-
112
-
113
-
114
-
115
-
116
-
117
-
118
-
119
-
120
-
121
-
122
-
123
-
124
-
125
-
126
-
127
-
128
-
129
-
130
-
131
-
132
-
133
-
134
-
135
-
136
-
137
-
138
-
139
-
140
-
141
-
142
-
143
-
144
-
145
-
146
-
147
-
148
-
149
-
150
-
151
-
152
-
153
-
154
-
155
-
156
-
157
-
158
-
159
-
160
-
161
-
162
-
163
-
164
-
165
-
166
-
167
-
168
-
169
-
170
-
171
-
172
-
173
-
174
-
175
-
176
-
177
-
178
-
179
-
180
-
181
-
182
-
183
-
184
-
185
-
186
-
187
-
188
-
189
-
 190
190 -
 191
191 -
 192
192 -
 193
193 -
 194
194 -
 195
195 -
 196
196 -
 197
197 -
 198
198 -
 199
199 -
 200
200 -
 201
201 -
 202
202 -
 203
203 -
 204
204 -
 205
205 -
 206
206 -
 207
207 -
 208
208 -
 209
209 -
 210
210 -
211
-
212
-
213
-
214
-
215
-
216
-
217
-
218
-
219
-
220
-
221
-
222
-
223
-
224
-
225
-
226
-
227
-
228
-
229
-
230
-
231
-
232
-
233
-
234
-
235
-
236
-
237
-
238
-
239
-
240
-
241
-
242
-
243
-
244
-
245
-
246
-
247
-
248
-
249
-
250
-
251
-
252
 |
 |

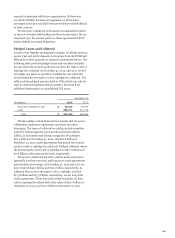
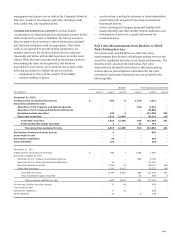
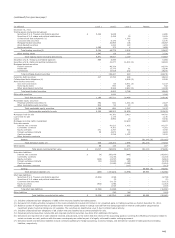
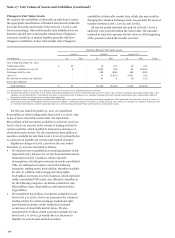
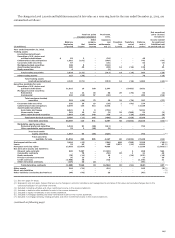
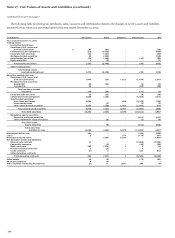
Note 16: Derivatives (continued)
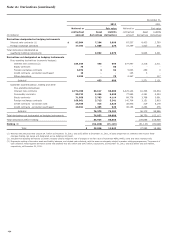
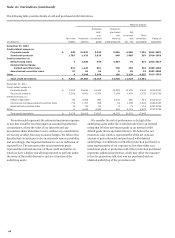
The following table provides details of sold and purchased credit derivatives.
Notional amount
Protection Protection
sold - purchased Net
non- with protection Other
Fair value Protection investment identical sold protection Range of
(in millions) liability sold (A) grade underlyings (B) (A) - (B) purchased maturities
December 31, 2012
Credit default swaps on:
Corporate bonds $ 240 15,845 8,448 9,636 6,209 7,701 2013-2021
Structured products 1,787 2,433 2,039 948 1,485 393 2016-2056
Credit protection on:
Default swap index 4 3,520 348 3,444 76 616 2013-2017
Commercial mortgage-
backed securities index 531 1,249 861 790 459 524 2049-2052
Asset-backed securities index 57 64 64 6 58 92 2037-2046
Other 4 3,344 3,344 106 3,238 4,655 2013-2056
Total credit derivatives $ 2,623 26,455 15,104 14,930 11,525 13,981
December 31, 2011
Credit default swaps on:
Corporate bonds $ 1,002 24,634 14,043 13,329 11,305 9,404 2012-2021
Structured products 3,308 4,691 4,300 2,194 2,497 1,335 2016-2056
Credit protection on:
Default swap index 68 3,006 843 2,341 665 912 2012-2017
Commercial mortgage-backed securities index 713 1,357 458 19 1,338 1,403 2049-2052
Asset-backed securities index 76 83 83 8 75 116 2037-2046
Other 11 4,632 4,090 481 4,151 4,673 2012-2056
Total credit derivatives $ 5,178 38,403 23,817 18,372 20,031 17,843
Protection sold represents the estimated maximum exposure
to loss that would be incurred under an assumed hypothetical
circumstance, where the value of our interests and any
associated collateral declines to zero, without any consideration
of recovery or offset from any economic hedges. We believe this
hypothetical circumstance to be an extremely remote possibility
and accordingly, this required disclosure is not an indication of
expected loss. The amounts under non-investment grade
represent the notional amounts of those credit derivatives on
which we have a higher risk of being required to perform under
the terms of the credit derivative and are a function of the
underlying assets.
We consider the risk of performance to be high if the
underlying assets under the credit derivative have an external
rating that is below investment grade or an internal credit
default grade that is equivalent thereto. We believe the net
protection sold, which is representative of the net notional
amount of protection sold and purchased with identical
underlyings, in combination with other protection purchased, is
more representative of our exposure to loss than either non-
investment grade or protection sold. Other protection purchased
represents additional protection, which may offset the exposure
to loss for protection sold, that was not purchased with an
identical underlying of the protection sold.
198