Wells Fargo 2012 Annual Report Download - page 228
Download and view the complete annual report
Please find page 228 of the 2012 Wells Fargo annual report below. You can navigate through the pages in the report by either clicking on the pages listed below, or by using the keyword search tool below to find specific information within the annual report.-
 1
1 -
2
-
3
-
4
-
5
-
6
-
7
-
8
-
9
-
10
-
11
-
12
-
13
-
14
-
15
-
16
-
17
-
18
-
19
-
20
-
21
-
22
-
23
-
24
-
25
-
26
-
27
-
28
-
29
-
30
-
31
-
32
-
33
-
34
-
35
-
36
-
37
-
38
-
39
-
40
-
41
-
42
-
43
-
44
-
45
-
46
-
47
-
48
-
49
-
50
-
51
-
52
-
53
-
54
-
55
-
56
-
57
-
58
-
59
-
60
-
61
-
62
-
63
-
64
-
65
-
66
-
67
-
68
-
69
-
70
-
71
-
72
-
73
-
74
-
75
-
76
-
77
-
78
-
79
-
80
-
81
-
82
-
83
-
84
-
85
-
86
-
87
-
88
-
89
-
90
-
91
-
92
-
93
-
94
-
95
-
96
-
97
-
98
-
99
-
100
-
101
-
102
-
103
-
104
-
105
-
106
-
107
-
108
-
109
-
110
-
111
-
112
-
113
-
114
-
115
-
116
-
117
-
118
-
119
-
120
-
121
-
122
-
123
-
124
-
125
-
126
-
127
-
128
-
129
-
130
-
131
-
132
-
133
-
134
-
135
-
136
-
137
-
138
-
139
-
140
-
141
-
142
-
143
-
144
-
145
-
146
-
147
-
148
-
149
-
150
-
151
-
152
-
153
-
154
-
155
-
156
-
157
-
158
-
159
-
160
-
161
-
162
-
163
-
164
-
165
-
166
-
167
-
168
-
169
-
170
-
171
-
172
-
173
-
174
-
175
-
176
-
177
-
178
-
179
-
180
-
181
-
182
-
183
-
184
-
185
-
186
-
187
-
188
-
189
-
190
-
191
-
192
-
193
-
194
-
195
-
196
-
197
-
198
-
199
-
200
-
201
-
202
-
203
-
204
-
205
-
206
-
207
-
208
-
209
-
210
-
211
-
212
-
213
-
214
-
215
-
216
-
217
-
 218
218 -
 219
219 -
 220
220 -
 221
221 -
 222
222 -
 223
223 -
 224
224 -
 225
225 -
 226
226 -
 227
227 -
 228
228 -
 229
229 -
 230
230 -
 231
231 -
 232
232 -
 233
233 -
 234
234 -
 235
235 -
 236
236 -
 237
237 -
 238
238 -
239
-
240
-
241
-
242
-
243
-
244
-
245
-
246
-
247
-
248
-
249
-
250
-
251
-
252
 |
 |

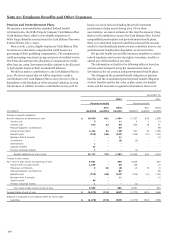
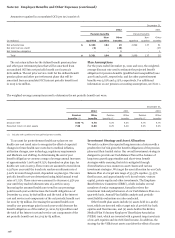
Note 20: Employee Benefits and Other Expenses
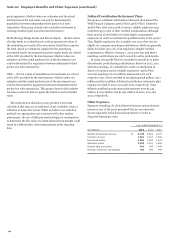
Pension and Postretirement Plans
We sponsor a noncontributory qualified defined benefit
retirement plan, the Wells Fargo & Company Cash Balance Plan
(Cash Balance Plan), which covers eligible employees of
Wells Fargo. Benefits accrued under the Cash Balance Plan were
frozen effective July 1, 2009.
Prior to July 1, 2009, eligible employees' Cash Balance Plan
accounts were allocated a compensation credit based on a
percentage of their qualifying compensation. The compensation
credit percentage was based on age and years of credited service.
The freeze discontinues the allocation of compensation credits
after June 30, 2009. Investment credits continue to be allocated
to participants based on their accumulated balances.
We did not make a contribution to our Cash Balance Plan in
2012. We do not expect that we will be required to make a
contribution to the Cash Balance Plan in 2013; however, this is
dependent on the finalization of the actuarial valuation in 2013.
Our decision of whether to make a contribution in 2013 will be
based on various factors including the actual investment
performance of plan assets during 2013. Given these
uncertainties, we cannot estimate at this time the amount, if any,
that we will contribute in 2013 to the Cash Balance Plan. For the
nonqualified pension plans and postretirement benefit plans,
there is no minimum required contribution beyond the amount
needed to fund benefit payments; we may contribute more to our
postretirement benefit plans dependent on various factors.
We provide health care and life insurance benefits for certain
retired employees and reserve the right to terminate, modify or
amend any of the benefits at any time.
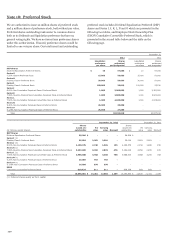
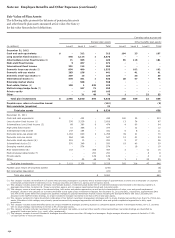
The information set forth in the following tables is based on
current actuarial reports using the measurement date of
December 31 for our pension and postretirement benefit plans.
The changes in the projected benefit obligation of pension
benefits and the accumulated postretirement benefit obligation
of other benefits and the fair value of plan assets, the funded
status and the amounts recognized in the balance sheet were:
December 31,
2012 2011
Pension benefits Pension benefits
Non- Other Non- Other
(in millions) Qualified qualified benefits Qualified qualified benefits
Change in benefit obligation:
Benefit obligation at beginning of year $ 10,634 691 1,304 10,337 693 1,398
Service cost 3 - 11 6 1 13
Interest cost 514 32 60 520 34 71
Plan participants’ contributions - - 80 - - 88
Actuarial loss (gain) 1,242 62 (23) 501 33 (105)
Benefits paid (725) (66) (147) (726) (70) (171)
Medicare Part D subsidy - - 11 - - 10
Curtailment - - (3) (3) - -
Amendments 1 - - - - -
Liability transfer 47 - - - - -
Foreign exchange impact 1 - - (1) - -
Benefit obligation at end of year 11,717 719 1,293 10,634 691 1,304
Change in plan assets:
Fair value of plan assets at beginning of year 9,061 - 640 9,639 - 697
Actual return on plan assets 1,149 - 55 139 - 10
Employer contribution 9 66 (3) 10 70 6
Plan participants’ contributions - - 80 - - 88
Benefits paid (725) (66) (147) (726) (70) (171)
Medicare Part D subsidy - - 11 - - 10
Asset transfer 44 - - - - -
Foreign exchange impact 1 - - (1) - -
Fair value of plan assets at end of year 9,539 - 636 9,061 - 640
Funded status at end of year $ (2,178) (719) (657) (1,573) (691) (664)
Amounts recognized in the balance sheet at end of year:
Liabilities $ (2,178) (719) (657) (1,573) (691) (664)
226