Wells Fargo 2012 Annual Report Download - page 177
Download and view the complete annual report
Please find page 177 of the 2012 Wells Fargo annual report below. You can navigate through the pages in the report by either clicking on the pages listed below, or by using the keyword search tool below to find specific information within the annual report.-
 1
1 -
2
-
3
-
4
-
5
-
6
-
7
-
8
-
9
-
10
-
11
-
12
-
13
-
14
-
15
-
16
-
17
-
18
-
19
-
20
-
21
-
22
-
23
-
24
-
25
-
26
-
27
-
28
-
29
-
30
-
31
-
32
-
33
-
34
-
35
-
36
-
37
-
38
-
39
-
40
-
41
-
42
-
43
-
44
-
45
-
46
-
47
-
48
-
49
-
50
-
51
-
52
-
53
-
54
-
55
-
56
-
57
-
58
-
59
-
60
-
61
-
62
-
63
-
64
-
65
-
66
-
67
-
68
-
69
-
70
-
71
-
72
-
73
-
74
-
75
-
76
-
77
-
78
-
79
-
80
-
81
-
82
-
83
-
84
-
85
-
86
-
87
-
88
-
89
-
90
-
91
-
92
-
93
-
94
-
95
-
96
-
97
-
98
-
99
-
100
-
101
-
102
-
103
-
104
-
105
-
106
-
107
-
108
-
109
-
110
-
111
-
112
-
113
-
114
-
115
-
116
-
117
-
118
-
119
-
120
-
121
-
122
-
123
-
124
-
125
-
126
-
127
-
128
-
129
-
130
-
131
-
132
-
133
-
134
-
135
-
136
-
137
-
138
-
139
-
140
-
141
-
142
-
143
-
144
-
145
-
146
-
147
-
148
-
149
-
150
-
151
-
152
-
153
-
154
-
155
-
156
-
157
-
158
-
159
-
160
-
161
-
162
-
163
-
164
-
165
-
166
-
 167
167 -
 168
168 -
 169
169 -
 170
170 -
 171
171 -
 172
172 -
 173
173 -
 174
174 -
 175
175 -
 176
176 -
 177
177 -
 178
178 -
 179
179 -
 180
180 -
 181
181 -
 182
182 -
 183
183 -
 184
184 -
 185
185 -
 186
186 -
 187
187 -
188
-
189
-
190
-
191
-
192
-
193
-
194
-
195
-
196
-
197
-
198
-
199
-
200
-
201
-
202
-
203
-
204
-
205
-
206
-
207
-
208
-
209
-
210
-
211
-
212
-
213
-
214
-
215
-
216
-
217
-
218
-
219
-
220
-
221
-
222
-
223
-
224
-
225
-
226
-
227
-
228
-
229
-
230
-
231
-
232
-
233
-
234
-
235
-
236
-
237
-
238
-
239
-
240
-
241
-
242
-
243
-
244
-
245
-
246
-
247
-
248
-
249
-
250
-
251
-
252
 |
 |

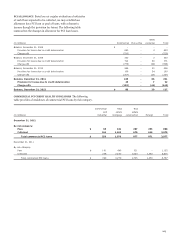
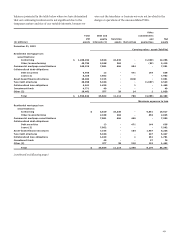
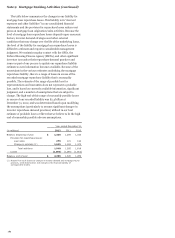
Year ended December 31,
2012 2011 2010
Other Other Other
Mortgage financial Mortgage financial Mortgage financial
(in millions) loans assets loans assets loans assets
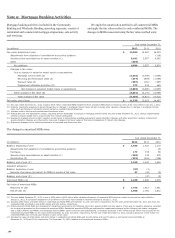
Sales proceeds from securitizations (1) $ 535,372 - 337,357 - 374,488 -
Servicing fees 4,433 10 4,401 11 4,316 34
Other interests held 1,767 135 1,779 263 1,786 442
Purchases of delinquent assets 62 - 9 - 25 -
Net servicing advances 226 - 29 - 49 -
(1) Represents cash flow data for all loans securitized in the period presented.
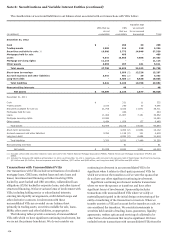
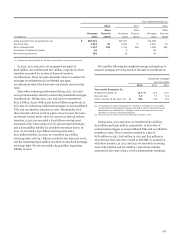
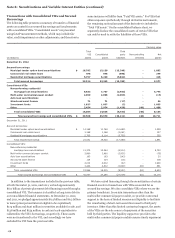
In 2012, 2011, and 2010, we recognized net gains of
$518 million, $112 million and $27 million, respectively, from
transfers accounted for as sales of financial assets in
securitizations. These net gains primarily relate to commercial
mortgage securitizations and residential mortgage
securitizations where the loans were not already carried at fair
value.
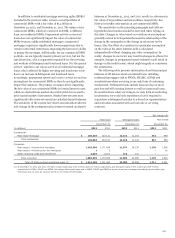
Sales with continuing involvement during 2012, 2011 and
2010 predominantly related to conforming residential mortgage
securitizations. During 2012, 2011 and 2010 we transferred
$517.3 billion, $329.1 billion and $379.0 billion respectively, in
fair value of conforming residential mortgages to unconsolidated
VIEs and recorded the transfers as sales. Substantially all of
these transfers did not result in a gain or loss because the loans
are already carried at fair value. In connection with all of these
transfers, in 2012 we recorded a $4.9 billion servicing asset,
measured at fair value using a Level 3 measurement technique,
and a $274 million liability for probable repurchase losses. In
2011, we recorded a $4.0 billion servicing asset and a
$101 million liability. In 2010, we recorded a $4.5 billion
servicing asset, with $4.1 billion recorded at fair value as Level 3
and the remaining $400 million recorded as amortized mortgage
servicing rights. We also recorded a $144 million repurchase
liability in 2010.
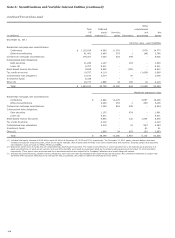
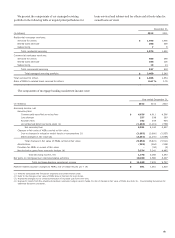
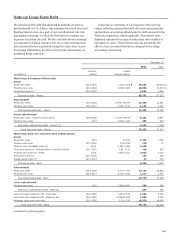
We used the following key weighted-average assumptions to
measure mortgage servicing assets at the date of securitization:
Residential mortgage
servicing rights
2012 2011 2010
Year ended December 31,
Prepayment speed (1) 13.4 % 12.8 13.5
Discount rate 7.3 7.7 5.4
Cost to service ($ per loan) (2) $ 151 146 151
(1) The prepayment speed assumption for residential mortgage servicing rights
includes a blend of prepayment speeds and default rates. Prepayment speed
assumptions are influenced by mortgage interest rate inputs as well as our
estimation of drivers of borrower behavior.
(2) Includes costs to service and unreimbursed foreclosure costs.
During 2012, 2011 and 2010, we transferred $3.4 billion,
$3.0 billion and $336 million, respectively, in fair value of
commercial mortgages to unconsolidated VIEs and recorded the
transfers as sales. These transfers resulted in a gain of
$178 million in 2012, $48 million in 2011 and $23 million in
2010 because the loans were carried at LOCOM. In connection
with these transfers, in 2012 and 2011 we recorded a servicing
asset of $13 million and $20 million, respectively, initially
measured at fair value using a Level 3 measurement technique.
175