Wells Fargo 2012 Annual Report Download - page 243
Download and view the complete annual report
Please find page 243 of the 2012 Wells Fargo annual report below. You can navigate through the pages in the report by either clicking on the pages listed below, or by using the keyword search tool below to find specific information within the annual report.-
 1
1 -
2
-
3
-
4
-
5
-
6
-
7
-
8
-
9
-
10
-
11
-
12
-
13
-
14
-
15
-
16
-
17
-
18
-
19
-
20
-
21
-
22
-
23
-
24
-
25
-
26
-
27
-
28
-
29
-
30
-
31
-
32
-
33
-
34
-
35
-
36
-
37
-
38
-
39
-
40
-
41
-
42
-
43
-
44
-
45
-
46
-
47
-
48
-
49
-
50
-
51
-
52
-
53
-
54
-
55
-
56
-
57
-
58
-
59
-
60
-
61
-
62
-
63
-
64
-
65
-
66
-
67
-
68
-
69
-
70
-
71
-
72
-
73
-
74
-
75
-
76
-
77
-
78
-
79
-
80
-
81
-
82
-
83
-
84
-
85
-
86
-
87
-
88
-
89
-
90
-
91
-
92
-
93
-
94
-
95
-
96
-
97
-
98
-
99
-
100
-
101
-
102
-
103
-
104
-
105
-
106
-
107
-
108
-
109
-
110
-
111
-
112
-
113
-
114
-
115
-
116
-
117
-
118
-
119
-
120
-
121
-
122
-
123
-
124
-
125
-
126
-
127
-
128
-
129
-
130
-
131
-
132
-
133
-
134
-
135
-
136
-
137
-
138
-
139
-
140
-
141
-
142
-
143
-
144
-
145
-
146
-
147
-
148
-
149
-
150
-
151
-
152
-
153
-
154
-
155
-
156
-
157
-
158
-
159
-
160
-
161
-
162
-
163
-
164
-
165
-
166
-
167
-
168
-
169
-
170
-
171
-
172
-
173
-
174
-
175
-
176
-
177
-
178
-
179
-
180
-
181
-
182
-
183
-
184
-
185
-
186
-
187
-
188
-
189
-
190
-
191
-
192
-
193
-
194
-
195
-
196
-
197
-
198
-
199
-
200
-
201
-
202
-
203
-
204
-
205
-
206
-
207
-
208
-
209
-
210
-
211
-
212
-
213
-
214
-
215
-
216
-
217
-
218
-
219
-
220
-
221
-
222
-
223
-
224
-
225
-
226
-
227
-
228
-
229
-
230
-
231
-
232
-
 233
233 -
 234
234 -
 235
235 -
 236
236 -
 237
237 -
 238
238 -
 239
239 -
 240
240 -
 241
241 -
 242
242 -
 243
243 -
 244
244 -
 245
245 -
 246
246 -
 247
247 -
 248
248 -
 249
249 -
 250
250 -
 251
251 -
 252
252
 |
 |

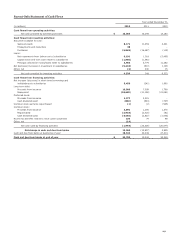
Parent-Only Statement of Cash Flows
Year ended December 31,
(in millions) 2012 2011 2010
Cash flows from operating activities:
Net cash provided by operating activities $ 13,365 15,049 14,180
Cash flows from investing activities:
Securities available for sale:
Sales proceeds 6,171 11,459 2,441
Prepayments and maturities 30 - -
Purchases (5,845) (16,487) (119)
Loans:
Net repayments from (advances to) subsidiaries 9,191 1,318 (5,485)
Capital notes and term loans made to subsidiaries (1,850) (1,340) -
Principal collected on notes/loans made to subsidiaries 2,462 5,779 11,282
Net decrease (increase) in investment in subsidiaries (5,218) (610) 1,198
Other, net (2) 230 15
Net cash provided by investing activities 4,939 349 9,332
Cash flows from financing activities:
Net increase (decrease) in short-term borrowings and
indebtedness to subsidiaries 5,456 (242) 1,860
Long-term debt:
Proceeds from issuance 16,989 7,058 1,789
Repayment (18,693) (31,198) (23,281)
Preferred stock:
Proceeds from issuance 1,377 2,501 -
Cash dividends paid (892) (844) (737)
Common stock warrants repurchased (1) (2) (545)
Common stock:
Proceeds from issuance 2,091 1,296 1,375
Repurchased (3,918) (2,416) (91)
Cash dividends paid (4,565) (2,537) (1,045)
Excess tax benefits related to stock option payments 226 79 98
Other, net (14) - -
Net cash used by financing activities (1,944) (26,305) (20,577)
Net change in cash and due from banks 16,360 (10,907) 2,935
Cash and due from banks at beginning of year 19,342 30,249 27,314
Cash and due from banks at end of year $ 35,702 19,342 30,249
241