Wells Fargo 2012 Annual Report Download - page 203
Download and view the complete annual report
Please find page 203 of the 2012 Wells Fargo annual report below. You can navigate through the pages in the report by either clicking on the pages listed below, or by using the keyword search tool below to find specific information within the annual report.-
 1
1 -
2
-
3
-
4
-
5
-
6
-
7
-
8
-
9
-
10
-
11
-
12
-
13
-
14
-
15
-
16
-
17
-
18
-
19
-
20
-
21
-
22
-
23
-
24
-
25
-
26
-
27
-
28
-
29
-
30
-
31
-
32
-
33
-
34
-
35
-
36
-
37
-
38
-
39
-
40
-
41
-
42
-
43
-
44
-
45
-
46
-
47
-
48
-
49
-
50
-
51
-
52
-
53
-
54
-
55
-
56
-
57
-
58
-
59
-
60
-
61
-
62
-
63
-
64
-
65
-
66
-
67
-
68
-
69
-
70
-
71
-
72
-
73
-
74
-
75
-
76
-
77
-
78
-
79
-
80
-
81
-
82
-
83
-
84
-
85
-
86
-
87
-
88
-
89
-
90
-
91
-
92
-
93
-
94
-
95
-
96
-
97
-
98
-
99
-
100
-
101
-
102
-
103
-
104
-
105
-
106
-
107
-
108
-
109
-
110
-
111
-
112
-
113
-
114
-
115
-
116
-
117
-
118
-
119
-
120
-
121
-
122
-
123
-
124
-
125
-
126
-
127
-
128
-
129
-
130
-
131
-
132
-
133
-
134
-
135
-
136
-
137
-
138
-
139
-
140
-
141
-
142
-
143
-
144
-
145
-
146
-
147
-
148
-
149
-
150
-
151
-
152
-
153
-
154
-
155
-
156
-
157
-
158
-
159
-
160
-
161
-
162
-
163
-
164
-
165
-
166
-
167
-
168
-
169
-
170
-
171
-
172
-
173
-
174
-
175
-
176
-
177
-
178
-
179
-
180
-
181
-
182
-
183
-
184
-
185
-
186
-
187
-
188
-
189
-
190
-
191
-
192
-
 193
193 -
 194
194 -
 195
195 -
 196
196 -
 197
197 -
 198
198 -
 199
199 -
 200
200 -
 201
201 -
 202
202 -
 203
203 -
 204
204 -
 205
205 -
 206
206 -
 207
207 -
 208
208 -
 209
209 -
 210
210 -
 211
211 -
 212
212 -
 213
213 -
214
-
215
-
216
-
217
-
218
-
219
-
220
-
221
-
222
-
223
-
224
-
225
-
226
-
227
-
228
-
229
-
230
-
231
-
232
-
233
-
234
-
235
-
236
-
237
-
238
-
239
-
240
-
241
-
242
-
243
-
244
-
245
-
246
-
247
-
248
-
249
-
250
-
251
-
252
 |
 |
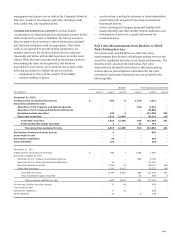
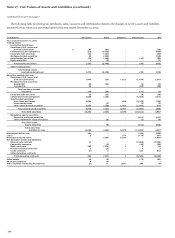
not recorded at fair value on a recurring basis, reverse mortgages
are held at fair value on a recurring basis. In addition, we record
nonrecurring fair value adjustments to loans to reflect partial
write-downs that are based on the observable market price of the
loan or current appraised value of the collateral.
We provide fair value estimates in this disclosure for loans
that are not recorded at fair value on a recurring or nonrecurring
basis. Those estimates differentiate loans based on their
financial characteristics, such as product classification, loan
category, pricing features and remaining maturity. Prepayment
and credit loss estimates are evaluated by product and loan rate.
The fair value of commercial loans is calculated by
discounting contractual cash flows, adjusted for credit loss
estimates, using discount rates that are appropriate for loans
with similar characteristics and remaining maturity.
For real estate 1-4 family first and junior lien mortgages, we
calculate fair value by discounting contractual cash flows,
adjusted for prepayment and credit loss estimates, using
discount rates based on current industry pricing (where readily
available) or our own estimate of an appropriate discount rate
for loans of similar size, type, remaining maturity and repricing
characteristics.
The carrying value of credit card loans, which is adjusted for
estimates of credit losses inherent in the portfolio at the balance
sheet date, is reported as a reasonable estimate of fair value. For
all other consumer loans, the fair value is generally calculated by
discounting the contractual cash flows, adjusted for prepayment
and credit loss estimates, based on the current rates we offer for
loans with similar characteristics.
Loan commitments, standby letters of credit and commercial
and similar letters of credit generate ongoing fees at our current
pricing levels, which are recognized over the term of the
commitment period. In situations where the credit quality of the
counterparty to a commitment has declined, we record an
allowance. A reasonable estimate of the fair value of these
instruments is the carrying value of deferred fees plus the related
allowance. Certain letters of credit that are hedged with
derivative instruments are carried at fair value in trading assets
or liabilities. For those letters of credit, fair value is calculated
based on readily quotable credit default spreads, using a market
risk credit default swap model.
DERIVATIVES Quoted market prices are available and used for
our exchange-traded derivatives, such as certain interest rate
futures and option contracts, which we classify as Level 1.
However, substantially all of our derivatives are traded in over-
the-counter (OTC) markets where quoted market prices are not
always readily available. Therefore we value most OTC
derivatives using internal valuation techniques. Valuation
techniques and inputs to internally-developed models depend on
the type of derivative and nature of the underlying rate, price or
index upon which the derivative's value is based. Key inputs can
include yield curves, credit curves, foreign-exchange rates,
prepayment rates, volatility measurements and correlation of
such inputs. Where model inputs can be observed in a liquid
market and the model does not require significant judgment,
such derivatives are typically classified as Level 2 of the fair
value hierarchy. Examples of derivatives classified as Level 2
include generic interest rate swaps, foreign currency swaps,
commodity swaps, and certain option and forward contracts.
When instruments are traded in less liquid markets and
significant inputs are unobservable, such derivatives are
classified as Level 3. Examples of derivatives classified as Level 3
include complex and highly structured derivatives, certain credit
default swaps, interest rate lock commitments written for our
residential mortgage loans that we intend to sell and long dated
equity options where volatility is not observable. Additionally,
significant judgments are required when classifying financial
instruments within the fair value hierarchy, particularly between
Level 2 and 3, as is the case for certain derivatives.
MORTGAGE SERVICING RIGHTS (MSRs) AND CERTAIN OTHER
INTERESTS HELD IN SECURITIZATIONS MSRs and certain
other interests held in securitizations (e.g., interest-only strips)
do not trade in an active market with readily observable prices.
Accordingly, we determine the fair value of MSRs using a
valuation model that calculates the present value of estimated
future net servicing income cash flows. The model incorporates
assumptions that market participants use in estimating future
net servicing income cash flows, including estimates of
prepayment speeds (including housing price volatility), discount
rate, default rates, cost to service (including delinquency and
foreclosure costs), escrow account earnings, contractual
servicing fee income, ancillary income and late fees. Commercial
MSRs are carried at lower of cost or market value, and therefore
can be subject to fair value measurements on a nonrecurring
basis. Changes in the fair value of MSRs occur primarily due to
the collection/realization of expected cash flows, as well as
changes in valuation inputs and assumptions. For other interests
held in securitizations (such as interest-only strips) we use a
valuation model that calculates the present value of estimated
future cash flows. The model incorporates our own estimates of
assumptions market participants use in determining the fair
value, including estimates of prepayment speeds, discount rates,
defaults and contractual fee income. Interest-only strips are
recorded as trading assets. Our valuation approach is validated
by our internal valuation model validation group. Fair value
measurements of our MSRs and interest-only strips use
significant unobservable inputs and, accordingly, we classify
them as Level 3.
FORECLOSED ASSETS Foreclosed assets are carried at net
realizable value, which represents fair value less costs to sell.
Fair value is generally based upon independent market prices or
appraised values of the collateral and, accordingly, we classify
foreclosed assets as Level 2.
NONMARKETABLE EQUITY INVESTMENTS Nonmarketable
equity investments are generally recorded under the cost or
equity method of accounting. There are generally restrictions on
the sale and/or liquidation of these investments, including
federal bank stock. Federal bank stock carrying value
approximates fair value. We use facts and circumstances
available to estimate the fair value of our nonmarketable equity
investments. We typically consider our access to and need for
capital (including recent or projected financing activity),
201