Wells Fargo 2012 Annual Report Download - page 45
Download and view the complete annual report
Please find page 45 of the 2012 Wells Fargo annual report below. You can navigate through the pages in the report by either clicking on the pages listed below, or by using the keyword search tool below to find specific information within the annual report.-
 1
1 -
2
-
3
-
4
-
5
-
6
-
7
-
8
-
9
-
10
-
11
-
12
-
13
-
14
-
15
-
16
-
17
-
18
-
19
-
20
-
21
-
22
-
23
-
24
-
25
-
26
-
27
-
28
-
29
-
30
-
31
-
32
-
33
-
34
-
 35
35 -
 36
36 -
 37
37 -
 38
38 -
 39
39 -
 40
40 -
 41
41 -
 42
42 -
 43
43 -
 44
44 -
 45
45 -
 46
46 -
 47
47 -
 48
48 -
 49
49 -
 50
50 -
 51
51 -
 52
52 -
 53
53 -
 54
54 -
 55
55 -
56
-
57
-
58
-
59
-
60
-
61
-
62
-
63
-
64
-
65
-
66
-
67
-
68
-
69
-
70
-
71
-
72
-
73
-
74
-
75
-
76
-
77
-
78
-
79
-
80
-
81
-
82
-
83
-
84
-
85
-
86
-
87
-
88
-
89
-
90
-
91
-
92
-
93
-
94
-
95
-
96
-
97
-
98
-
99
-
100
-
101
-
102
-
103
-
104
-
105
-
106
-
107
-
108
-
109
-
110
-
111
-
112
-
113
-
114
-
115
-
116
-
117
-
118
-
119
-
120
-
121
-
122
-
123
-
124
-
125
-
126
-
127
-
128
-
129
-
130
-
131
-
132
-
133
-
134
-
135
-
136
-
137
-
138
-
139
-
140
-
141
-
142
-
143
-
144
-
145
-
146
-
147
-
148
-
149
-
150
-
151
-
152
-
153
-
154
-
155
-
156
-
157
-
158
-
159
-
160
-
161
-
162
-
163
-
164
-
165
-
166
-
167
-
168
-
169
-
170
-
171
-
172
-
173
-
174
-
175
-
176
-
177
-
178
-
179
-
180
-
181
-
182
-
183
-
184
-
185
-
186
-
187
-
188
-
189
-
190
-
191
-
192
-
193
-
194
-
195
-
196
-
197
-
198
-
199
-
200
-
201
-
202
-
203
-
204
-
205
-
206
-
207
-
208
-
209
-
210
-
211
-
212
-
213
-
214
-
215
-
216
-
217
-
218
-
219
-
220
-
221
-
222
-
223
-
224
-
225
-
226
-
227
-
228
-
229
-
230
-
231
-
232
-
233
-
234
-
235
-
236
-
237
-
238
-
239
-
240
-
241
-
242
-
243
-
244
-
245
-
246
-
247
-
248
-
249
-
250
-
251
-
252
 |
 |

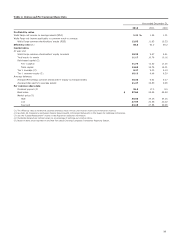
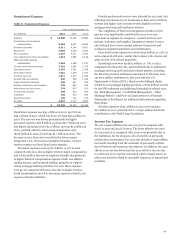
Noninterest Expense
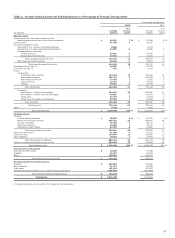
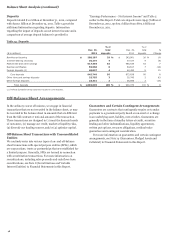
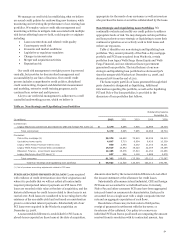
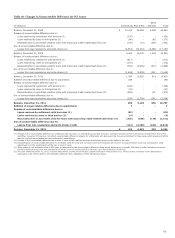
Table 8: Noninterest Expense
Year ended December 31,
(in millions) 2012 2011 2010
Salaries $ 14,689 14,462 13,869
Commission and incentive
compensation 9,504 8,857 8,692
Employee benefits 4,611 4,348 4,651
Equipment 2,068 2,283 2,636
Net occupancy 2,857 3,011 3,030
Core deposit and other intangibles 1,674 1,880 2,199
FDIC and other deposit
assessments 1,356 1,266 1,197
Outside professional services 2,729 2,692 2,370
Operating losses 2,235 1,261 1,258
Foreclosed assets 1,061 1,354 1,537
Contract services 1,011 1,407 1,642
Outside data processing 910 935 1,046
Travel and entertainment 839 821 783
Postage, stationery and supplies 799 942 944
Advertising and promotion 578 607 630
Telecommunications 500 523 596
Insurance 453 515 464
Operating leases 109 112 109
All other 2,415 2,117 2,803
Total $ 50,398 49,393 50,456
Noninterest expense was $50.4 billion in 2012, up 2% from
$49.4 billion in 2011, which was down 2% from $50.5 billion in
2010. The increase was driven predominantly by higher
personnel expense ($28.8 billion, up from $27.7 billion in 2011)
and higher operating losses ($2.2 billion, up from $1.3 billion in
2011), partially offset by lower merger integration costs
($218 million in 2012, down from $1.7 billion in 2011). The
decrease in 2011 from 2010 was driven by lower merger
integration costs, decreases in equipment expense, contract
services expense and foreclosed assets expense.
Personnel expenses were up $1.1 billion, or 4%, in 2012
compared with 2011, due to higher revenue-based compensation
and a $263 million increase in employee benefits due primarily
to higher deferred compensation expense which was offset in
trading income, and increased staffing, primarily to support
strong mortgage banking activities. For 2011 these expenses
were up 2% compared with 2010, also due to higher revenue-
based compensation as well as severance expense related to our
expense reduction initiative.
Outside professional services were elevated for 2012 and 2011
reflecting investments by our businesses in their service delivery
systems and higher costs associated with regulatory driven
mortgage servicing and foreclosure matters.
The completion of Wachovia integration activities in first
quarter 2012 significantly contributed to year-over-year
reductions in equipment, occupancy, contract services, and
postage, stationery and supplies. Equipment expense in 2012
also declined due to lower annual software license fees and
savings in equipment purchases and maintenance.
Foreclosed assets expense was down $293 million, or 22%, in
2012 compared with 2011, mainly due to lower write-downs and
gains on sale of foreclosed properties.
Operating losses were up $974 million, or 77%, in 2012
compared with the prior year, predominantly due to additional
mortgage servicing and foreclosure-related matters, including
the Attorneys General settlement announced in February 2012,
our $175 million settlement in July 2012 with the U.S.
Department of Justice (DOJ), which resolved alleged claims
related to our mortgage lending practices, a $766 million accrual
for the IFR settlement and additional remediation-related costs.
See “Risk Management – Credit Risk Management – Other
Mortgage Matters” and Note 15 (Legal Actions) to Financial
Statements in this Report for additional information regarding
these items.
All other expenses of $2.4 billion in 2012 were up from
$2.1 billion in 2011, primarily due to a $250 million charitable
contribution to the Wells Fargo Foundation.
Income Tax Expense
The 2012 annual effective tax rate was 32.5% compared with
31.9% in 2011 and 33.9% in 2010. The lower effective tax rates
for 2012 and 2011, compared with 2010, were primarily due to
the realization, for tax purposes, of tax benefits on previously
written down investments. For 2012 this includes a $332 million
tax benefit resulting from the surrender of previously written-
down Wachovia life insurance investments. In addition, the 2011
effective tax rate was lower than the 2010 effective tax rate due
to a decrease in tax expense associated with leveraged leases, as
well as tax benefits related to charitable donations of appreciated
securities.
43