Wells Fargo 2012 Annual Report Download - page 59
Download and view the complete annual report
Please find page 59 of the 2012 Wells Fargo annual report below. You can navigate through the pages in the report by either clicking on the pages listed below, or by using the keyword search tool below to find specific information within the annual report.-
 1
1 -
2
-
3
-
4
-
5
-
6
-
7
-
8
-
9
-
10
-
11
-
12
-
13
-
14
-
15
-
16
-
17
-
18
-
19
-
20
-
21
-
22
-
23
-
24
-
25
-
26
-
27
-
28
-
29
-
30
-
31
-
32
-
33
-
34
-
35
-
36
-
37
-
38
-
39
-
40
-
41
-
42
-
43
-
44
-
45
-
46
-
47
-
48
-
 49
49 -
 50
50 -
 51
51 -
 52
52 -
 53
53 -
 54
54 -
 55
55 -
 56
56 -
 57
57 -
 58
58 -
 59
59 -
 60
60 -
 61
61 -
 62
62 -
 63
63 -
 64
64 -
 65
65 -
 66
66 -
 67
67 -
 68
68 -
 69
69 -
70
-
71
-
72
-
73
-
74
-
75
-
76
-
77
-
78
-
79
-
80
-
81
-
82
-
83
-
84
-
85
-
86
-
87
-
88
-
89
-
90
-
91
-
92
-
93
-
94
-
95
-
96
-
97
-
98
-
99
-
100
-
101
-
102
-
103
-
104
-
105
-
106
-
107
-
108
-
109
-
110
-
111
-
112
-
113
-
114
-
115
-
116
-
117
-
118
-
119
-
120
-
121
-
122
-
123
-
124
-
125
-
126
-
127
-
128
-
129
-
130
-
131
-
132
-
133
-
134
-
135
-
136
-
137
-
138
-
139
-
140
-
141
-
142
-
143
-
144
-
145
-
146
-
147
-
148
-
149
-
150
-
151
-
152
-
153
-
154
-
155
-
156
-
157
-
158
-
159
-
160
-
161
-
162
-
163
-
164
-
165
-
166
-
167
-
168
-
169
-
170
-
171
-
172
-
173
-
174
-
175
-
176
-
177
-
178
-
179
-
180
-
181
-
182
-
183
-
184
-
185
-
186
-
187
-
188
-
189
-
190
-
191
-
192
-
193
-
194
-
195
-
196
-
197
-
198
-
199
-
200
-
201
-
202
-
203
-
204
-
205
-
206
-
207
-
208
-
209
-
210
-
211
-
212
-
213
-
214
-
215
-
216
-
217
-
218
-
219
-
220
-
221
-
222
-
223
-
224
-
225
-
226
-
227
-
228
-
229
-
230
-
231
-
232
-
233
-
234
-
235
-
236
-
237
-
238
-
239
-
240
-
241
-
242
-
243
-
244
-
245
-
246
-
247
-
248
-
249
-
250
-
251
-
252
 |
 |

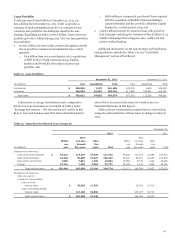
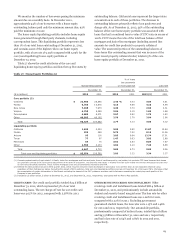
FOREIGN LOANS AND EUROPEAN EXPOSURE We classify
loans as foreign if the borrower’s primary address is outside of
the United States. At December 31, 2012, foreign loans totaled
$37.8 billion, representing approximately 5% of our total
consolidated loans outstanding and approximately 3% of our
total assets.
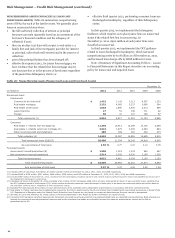
Our foreign country risk monitoring process incorporates
frequent dialogue with our foreign financial institution
customers, counterparties and with regulatory agencies,
enhanced by centralized monitoring of macroeconomic and
capital markets conditions. We establish exposure limits for
each country through a centralized oversight process based on
the needs of our customers, and in consideration of relevant
economic, political, social, legal, and transfer risks. We monitor
exposures closely and adjust our limits in response to changing
conditions.
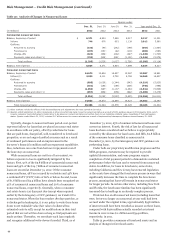
We evaluate our individual country risk exposure on an
ultimate country of risk basis which is normally based on the
country of residence of the guarantor or collateral location. Our
largest foreign country exposure on an ultimate risk basis was
the United Kingdom, which amounted to approximately
$15.9 billion, or 1% of our total assets, and included $2.3
billion of sovereign claims. Our United Kingdom sovereign
claims arise primarily from deposits we have placed with the
Bank of England pursuant to regulatory requirements in
support of our London branch.
At December 31, 2012, our Eurozone exposure, including
cross-border claims on an ultimate risk basis, and foreign
exchange and derivative products, aggregated approximately
$10.5 billion, including $232 million of sovereign claims,
compared with approximately $11.4 billion at
December 31, 2011, which included $364 million of sovereign
claims. Our Eurozone exposure is relatively small compared to
our overall credit risk exposure and is diverse by country, type,
and counterparty.
We conduct periodic stress tests of our significant country
risk exposures, analyzing the direct and indirect impacts on the
risk of loss from various macroeconomic and capital markets
scenarios. We do not have significant exposure to foreign
country risks because our foreign portfolio is relatively small.
However, we have identified exposure to increased loss from
U.S. borrowers associated with the potential impact of a
European downturn on the U.S. economy. We mitigate these
potential impacts on the risk of loss through our normal risk
management processes which include active monitoring and, if
necessary, the application of aggressive loss mitigation
strategies.
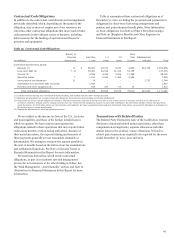
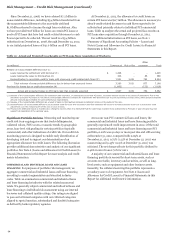
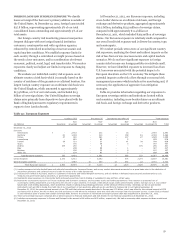
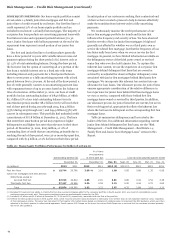
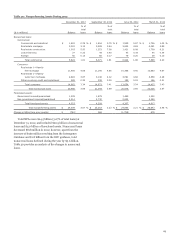
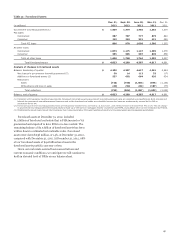
Table 22 provides information regarding our exposures to
European sovereign entities and institutions located within
such countries, including cross-border claims on an ultimate
risk basis, and foreign exchange and derivative products.
Table 22: European Exposure
Lending (1)(2) Securities (3) Derivatives and other (4) Total exposure
Non- Non- Non- Non-
(in millions) Sovereign sovereign Sovereign sovereign Sovereign sovereign Sovereign sovereign (5) Total
December 31, 2012
Eurozone
Netherlands $ - 2,542 - 334 - 18 - 2,894 2,894
Germany 61 1,934 - 210 - 159 61 2,303 2,364
France 27 920 - 461 - 147 27 1,528 1,555
Luxembourg - 891 - 82 - 5 - 978 978
Ireland 39 721 - 37 - 41 39 799 838
Spain - 735 - 59 - 3 - 797 797
Austria 105 250 - 6 - - 105 256 361
Italy - 238 - 88 - 1 - 327 327
Belgium - 156 - 32 - 9 - 197 197
Other (6) - 104 - 82 - 2 - 188 188
Total Eurozone exposure 232 8,491 - 1,391 - 385 232 10,267 10,499
United Kingdom 2,274 6,541 - 6,492 - 574 2,274 13,607 15,881
Other European countries - 3,887 10 250 12 564 22 4,701 4,723
Total European exposure $ 2,506 18,919 10 8,133 12 1,523 2,528 28,575 31,103
(1) Lending exposure includes funded loans and unfunded commitments, leveraged leases, and money market placements presented on a gross basis prior to the deduction of
impairment allowance and collateral received under the terms of the credit agreements.
(2) Includes $871 million in PCI loans, largely to customers in Germany and United Kingdom territories, and $2.4 billion in defeased leases secured predominantly by U.S.
Treasury and government agency securities, or government guaranteed.
(3) Represents issuer exposure on cross-border debt and equity securities, held in trading or available-for-sale portfolio, at fair value.
(4) Represents counterparty exposure on foreign exchange and derivative contracts, and securities resale and lending agreements. This exposure is presented net of
counterparty netting adjustments and reduced by the amount of cash collateral. It includes credit default swaps (CDS) predominantly used to manage our U.S. and London-
based cash credit trading businesses, which sometimes results in selling and purchasing protection on the identical reference entity. Generally, we do not use market
instruments such as CDS to hedge the credit risk of our investment or loan positions, although we do use them to manage risk in our trading businesses. At
December 31, 2012, the gross notional amount of our CDS sold that reference assets domiciled in Europe was $7.5 billion, which was offset by the notional amount of CDS
purchased of $7.6 billion. We did not have any CDS purchased or sold where the reference asset was solely the sovereign debt of a European country. Certain CDS purchased
or sold reference pools of assets that contain sovereign debt, however the amount of referenced sovereign European debt was insignificant at December 31, 2012.
(5) Total non-sovereign exposure comprises $13.1 billion exposure to financial institutions and $15.5 billion to non-financial corporations at December 31, 2012.
(6) Includes non-sovereign exposure to Greece and Portugal in the amount of $6 million and $30 million, respectively. We had no sovereign debt exposure to these countries at
December 31, 2012.
57