Wells Fargo 2012 Annual Report Download - page 43
Download and view the complete annual report
Please find page 43 of the 2012 Wells Fargo annual report below. You can navigate through the pages in the report by either clicking on the pages listed below, or by using the keyword search tool below to find specific information within the annual report.-
 1
1 -
2
-
3
-
4
-
5
-
6
-
7
-
8
-
9
-
10
-
11
-
12
-
13
-
14
-
15
-
16
-
17
-
18
-
19
-
20
-
21
-
22
-
23
-
24
-
25
-
26
-
27
-
28
-
29
-
30
-
31
-
32
-
 33
33 -
 34
34 -
 35
35 -
 36
36 -
 37
37 -
 38
38 -
 39
39 -
 40
40 -
 41
41 -
 42
42 -
 43
43 -
 44
44 -
 45
45 -
 46
46 -
 47
47 -
 48
48 -
 49
49 -
 50
50 -
 51
51 -
 52
52 -
 53
53 -
54
-
55
-
56
-
57
-
58
-
59
-
60
-
61
-
62
-
63
-
64
-
65
-
66
-
67
-
68
-
69
-
70
-
71
-
72
-
73
-
74
-
75
-
76
-
77
-
78
-
79
-
80
-
81
-
82
-
83
-
84
-
85
-
86
-
87
-
88
-
89
-
90
-
91
-
92
-
93
-
94
-
95
-
96
-
97
-
98
-
99
-
100
-
101
-
102
-
103
-
104
-
105
-
106
-
107
-
108
-
109
-
110
-
111
-
112
-
113
-
114
-
115
-
116
-
117
-
118
-
119
-
120
-
121
-
122
-
123
-
124
-
125
-
126
-
127
-
128
-
129
-
130
-
131
-
132
-
133
-
134
-
135
-
136
-
137
-
138
-
139
-
140
-
141
-
142
-
143
-
144
-
145
-
146
-
147
-
148
-
149
-
150
-
151
-
152
-
153
-
154
-
155
-
156
-
157
-
158
-
159
-
160
-
161
-
162
-
163
-
164
-
165
-
166
-
167
-
168
-
169
-
170
-
171
-
172
-
173
-
174
-
175
-
176
-
177
-
178
-
179
-
180
-
181
-
182
-
183
-
184
-
185
-
186
-
187
-
188
-
189
-
190
-
191
-
192
-
193
-
194
-
195
-
196
-
197
-
198
-
199
-
200
-
201
-
202
-
203
-
204
-
205
-
206
-
207
-
208
-
209
-
210
-
211
-
212
-
213
-
214
-
215
-
216
-
217
-
218
-
219
-
220
-
221
-
222
-
223
-
224
-
225
-
226
-
227
-
228
-
229
-
230
-
231
-
232
-
233
-
234
-
235
-
236
-
237
-
238
-
239
-
240
-
241
-
242
-
243
-
244
-
245
-
246
-
247
-
248
-
249
-
250
-
251
-
252
 |
 |

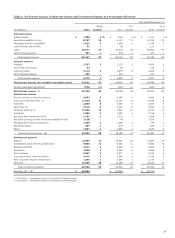
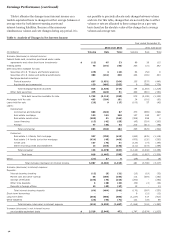
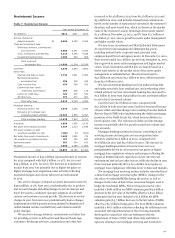
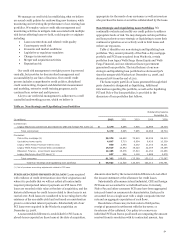
Noninterest Income
Table 7: Noninterest Income
Year ended December 31,
(in millions) 2012 2011 2010
Service charges on
deposit accounts $ 4,683 4,280 4,916
Trust and investment fees:
Brokerage advisory, commissions
and other fees 6,386 6,241 5,930
Trust, investment and IRA fees 4,218 4,099 4,038
Investment banking fees 1,286 964 966
Total trust and
investment fees 11,890 11,304 10,934
Card fees 2,838 3,653 3,652
Other fees:
Charges and fees on loans 1,746 1,641 1,690
Merchant transaction
processing fees 583 478 444
Cash network fees 470 389 260
Commercial real estate
brokerage commissions 307 236 176
Letters of credit fees 441 472 523
All other fees 972 977 897
Total other fees 4,519 4,193 3,990
Mortgage banking:
Servicing income, net 1,378 3,266 3,340
Net gains on mortgage loan
origination/sales activities 10,260 4,566 6,397
Total mortgage banking 11,638 7,832 9,737
Insurance 1,850 1,960 2,126
Net gains from trading activities 1,707 1,014 1,648
Net gains (losses) on debt
securities available for sale (128) 54 (324)
Net gains from equity investments 1,485 1,482 779
Life insurance investment income 757 700 697
Operating leases 567 524 815
All other 1,050 1,189 1,483
Total $ 42,856 38,185 40,453
Noninterest income of $42.9 billion represented 50% of revenue
for 2012 compared with $38.2 billion, or 47%, for 2011 and
$40.5 billion, or 47%, for 2010. The increase in noninterest
income from 2011 was primarily due to higher net gains on
higher mortgage loan origination/sales activities reflecting
increased margins and a lower interest rate environment
in 2012.
Our service charges on deposit accounts increased in 2012 by
$403 million, or 9%, from 2011, predominantly due to product
and account changes including changes to service charges and
fewer fee waivers, continued customer adoption of overdraft
services and customer account growth. The decrease in service
charges in 2011 from 2010 was predominantly due to changes
implemented in third quarter 2010 mandated by Regulation E
(which limited certain overdraft fees) and related overdraft
policy changes.
We receive brokerage advisory, commissions and other fees
for providing services to full-service and discount brokerage
customers. Brokerage advisory, commissions and other fees
increased to $6.4 billion in 2012 from $6.2 billion in 2011 and
$5.9 billion in 2010, and includes transactional commissions
based on the number of transactions executed at the customer’s
direction, and asset-based fees, which are based on the market
value of the customer’s assets. Brokerage client assets totaled
$1.2 trillion at December 31, 2012, up 8% from $1.1 trillion at
December 31, 2011, due to growth in assets under management
and higher market values.
We earn trust, investment and IRA (Individual Retirement
Account) fees from managing and administering assets,
including mutual funds, corporate trust, personal trust,
employee benefit trust and agency assets. At December 31, 2012,
these assets totaled $2.2 trillion, up 3% from December 31, 2011,
due to growth in assets under management and higher market
values. Trust, investment and IRA fees are largely based on a
tiered scale relative to the market value of the assets under
management or administration. These fees increased to
$4.2 billion in 2012 from $4.1 billion in 2011, which increased
from $4.0 billion in 2010.
We earn investment banking fees from underwriting debt
and equity securities, loan syndications, and performing other
related advisory services. Investment banking fees increased to
$1.3 billion in 2012 from $964 million in 2011 and $966 million
in 2010 due to increased volume.
Card fees were $2.8 billion in 2012, compared with
$3.7 billion in both 2011 and 2010. Card fees decreased because
of lower debit card interchange rates resulting from the Federal
Reserve Board (FRB) rules implementing the debit interchange
provision of the Dodd-Frank Act, which became effective in
fourth quarter 2011. The reduction in debit card interchange
income was partially offset by growth in purchase volume and
new accounts.
Mortgage banking noninterest income, consisting of net
servicing income and net gains on loan origination/sales
activities, totaled $11.6 billion in 2012, compared with
$7.8 billion in 2011 and $9.7 billion in 2010. The increase in
mortgage banking noninterest income from 2011 was
predominantly driven by an increase in net gains on higher
mortgage loan origination volumes and margins reflecting the
impact of limited industry capacity in a lower interest rate
environment and various other factors, while the decline in 2011
from 2010 was primarily driven by a decline in net gains on
mortgage loan originations reflecting lower volume and margins.
Net mortgage loan servicing income includes amortization of
commercial mortgage servicing rights (MSRs), changes in the
fair value of residential MSRs during the period, as well as
changes in the value of derivatives (economic hedges) used to
hedge the residential MSRs. Net servicing income for 2012
included a $681 million net MSR valuation gain ($2.9 billion
decrease in the fair value of the MSRs offset by a $3.6 billion
hedge gain) and for 2011 included a $1.6 billion net MSR
valuation gain ($3.7 billion decrease in the fair value of MSRs
offset by a $5.3 billion hedge gain). The 2012 MSRs valuation
included a $677 million reduction reflecting the additional costs
associated with implementation of the servicing standards
developed in connection with our settlement with the
Department of Justice (DOJ) and other state and federal
agencies relating to our mortgage servicing and foreclosure
41