Wells Fargo 2012 Annual Report Download - page 86
Download and view the complete annual report
Please find page 86 of the 2012 Wells Fargo annual report below. You can navigate through the pages in the report by either clicking on the pages listed below, or by using the keyword search tool below to find specific information within the annual report.-
 1
1 -
2
-
3
-
4
-
5
-
6
-
7
-
8
-
9
-
10
-
11
-
12
-
13
-
14
-
15
-
16
-
17
-
18
-
19
-
20
-
21
-
22
-
23
-
24
-
25
-
26
-
27
-
28
-
29
-
30
-
31
-
32
-
33
-
34
-
35
-
36
-
37
-
38
-
39
-
40
-
41
-
42
-
43
-
44
-
45
-
46
-
47
-
48
-
49
-
50
-
51
-
52
-
53
-
54
-
55
-
56
-
57
-
58
-
59
-
60
-
61
-
62
-
63
-
64
-
65
-
66
-
67
-
68
-
69
-
70
-
71
-
72
-
73
-
74
-
75
-
 76
76 -
 77
77 -
 78
78 -
 79
79 -
 80
80 -
 81
81 -
 82
82 -
 83
83 -
 84
84 -
 85
85 -
 86
86 -
 87
87 -
 88
88 -
 89
89 -
 90
90 -
 91
91 -
 92
92 -
 93
93 -
 94
94 -
 95
95 -
 96
96 -
97
-
98
-
99
-
100
-
101
-
102
-
103
-
104
-
105
-
106
-
107
-
108
-
109
-
110
-
111
-
112
-
113
-
114
-
115
-
116
-
117
-
118
-
119
-
120
-
121
-
122
-
123
-
124
-
125
-
126
-
127
-
128
-
129
-
130
-
131
-
132
-
133
-
134
-
135
-
136
-
137
-
138
-
139
-
140
-
141
-
142
-
143
-
144
-
145
-
146
-
147
-
148
-
149
-
150
-
151
-
152
-
153
-
154
-
155
-
156
-
157
-
158
-
159
-
160
-
161
-
162
-
163
-
164
-
165
-
166
-
167
-
168
-
169
-
170
-
171
-
172
-
173
-
174
-
175
-
176
-
177
-
178
-
179
-
180
-
181
-
182
-
183
-
184
-
185
-
186
-
187
-
188
-
189
-
190
-
191
-
192
-
193
-
194
-
195
-
196
-
197
-
198
-
199
-
200
-
201
-
202
-
203
-
204
-
205
-
206
-
207
-
208
-
209
-
210
-
211
-
212
-
213
-
214
-
215
-
216
-
217
-
218
-
219
-
220
-
221
-
222
-
223
-
224
-
225
-
226
-
227
-
228
-
229
-
230
-
231
-
232
-
233
-
234
-
235
-
236
-
237
-
238
-
239
-
240
-
241
-
242
-
243
-
244
-
245
-
246
-
247
-
248
-
249
-
250
-
251
-
252
 |
 |

Risk Management – Asset/Liability Management (continued)
sheet. Additionally, we may enter into separate derivative or
security positions to manage our exposure related to our long or
short security positions. Collectively, income earned on this type
of market-making activity is reflected in the fair value changes of
these positions recorded in net gain (losses) on trading activities.
Economic hedges and other Economic hedges in trading are not
designated in a hedge accounting relationship and exclude
economic hedging related to our asset/liability risk management
and substantially all mortgage banking risk management
activities. Economic hedging activities include the use of trading
securities to economically hedge risk exposures related to non-
trading activities or derivatives to hedge risk exposures related
to trading assets or trading liabilities. Economic hedges are
unrelated to our customer accommodation activities. Other
activities include financial assets held for investment purposes
that we elected to carry at fair value with changes in fair value
recorded to earnings in order to mitigate accounting
measurement mismatches or avoid embedded derivative
accounting complexities.
Proprietary trading Proprietary trading consists of security or
derivative positions executed for our own account based upon
market expectations or to benefit from price differences between
financial instruments and markets. Proprietary trading activity
is expected to be restricted by the Dodd-Frank Act prohibitions
known as the “Volcker Rule,” which has not yet been finalized.
On October 11, 2011, federal banking agencies and the SEC
issued proposed regulations to implement the Volcker Rule. We
believe our definition of proprietary trading is consistent with
the proposed regulations. However, given that final rule-making
is required by various governmental regulatory agencies to
define proprietary trading within the context of the final Volcker
Rule, our definition of proprietary trading may change. We have
reduced or exited certain business activities in anticipation of the
final Volcker Rule. As discussed within this section and the
noninterest income section of our financial results, proprietary
trading activity is not significant to our business or financial
results.
Risk Measurement Value-at-Risk (VaR) is a standardized
approach for monitoring and reporting market risk. We use VaR
metrics complemented with sensitivity analysis and stress
testing in managing and measuring the risk associated with
trading activities.
Value-at-Risk VaR is a statistical risk measure used to estimate
the potential loss from adverse market moves on trading and
other positions carried at fair value. VaR is determined using a
historical simulation approach and measures the worst expected
loss over a given time interval and within a given confidence
interval. We measure and report daily VaR at a 99% confidence
interval based on actual changes in rates and prices over each
trading day in the previous year.
The historical simulation approach is used to identify the
critical risk driver of each trading position with respect to
interest rates, credit spreads, foreign exchange rates, and equity
and commodity prices. The risk drivers for each position are
updated on a daily basis. The historical simulation approach
employs historical scenarios of the risk factors from each trading
day in the previous year, and estimates the value of the portfolio
on the scenarios to obtain a daily net trading revenue
distribution.
The Company calculates VaR for management purposes as
well as for regulatory purposes. The management view of VaR is
used for trading limits and is a wider view of risk compared to
Total Regulatory VaR. Total Regulatory VaR is calculated
according to regulatory rules and is used to calculate market risk
regulatory capital. It includes both General VaR and Specific
Risk VaR. Regulatory General VaR is the risk of loss due to broad
market movements such as movements in interest rates, equity
prices or foreign exchange rates. Specific Risk VaR is the risk of
loss on a position that could result from factors other than broad
market movements and includes event risk, default risk and
idiosyncratic risk.
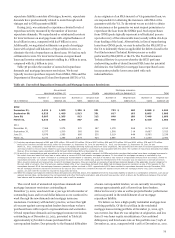
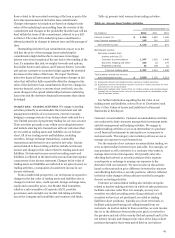
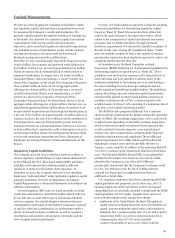
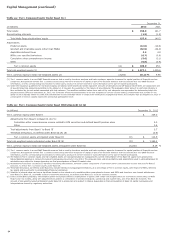
Table 43 below shows the results of the Company’s
Regulatory General VaR measures for 2012.
Table 43: Regulatory General Value-at-Risk (VaR)
Year ended December 31, 2012
Period
(in millions) end Average Low High
Risk Categories
Credit $ 19 23 10 43
Interest rate 13 19 7 41
Equity 5 5 3 12
Commodity 1 2 1 5
Foreign exchange 4 2 - 6
Diversification benefit (24) (1) (27) (1) - -
Total $ 18 24
(1) The period-end VaR and average VaR were less than the sum of the VaR
components described above, which is due to portfolio diversification. The
diversification effect arises because the risks are not perfectly correlated causing
a portfolio of positions to usually be less risky than the sum of the risks of the
positions alone.
84