Vodafone 2009 Annual Report Download - page 97
Download and view the complete annual report
Please find page 97 of the 2009 Vodafone annual report below. You can navigate through the pages in the report by either clicking on the pages listed below, or by using the keyword search tool below to find specific information within the annual report.-
 1
1 -
2
-
3
-
4
-
5
-
6
-
7
-
8
-
9
-
10
-
11
-
12
-
13
-
14
-
15
-
16
-
17
-
18
-
19
-
20
-
21
-
22
-
23
-
24
-
25
-
26
-
27
-
28
-
29
-
30
-
31
-
32
-
33
-
34
-
35
-
36
-
37
-
38
-
39
-
40
-
41
-
42
-
43
-
44
-
45
-
46
-
47
-
48
-
49
-
50
-
51
-
52
-
53
-
54
-
55
-
56
-
57
-
58
-
59
-
60
-
61
-
62
-
63
-
64
-
65
-
66
-
67
-
68
-
69
-
70
-
71
-
72
-
73
-
74
-
75
-
76
-
77
-
78
-
79
-
80
-
81
-
82
-
83
-
84
-
85
-
86
-
 87
87 -
 88
88 -
 89
89 -
 90
90 -
 91
91 -
 92
92 -
 93
93 -
 94
94 -
 95
95 -
 96
96 -
 97
97 -
 98
98 -
 99
99 -
 100
100 -
 101
101 -
 102
102 -
 103
103 -
 104
104 -
 105
105 -
 106
106 -
 107
107 -
108
-
109
-
110
-
111
-
112
-
113
-
114
-
115
-
116
-
117
-
118
-
119
-
120
-
121
-
122
-
123
-
124
-
125
-
126
-
127
-
128
-
129
-
130
-
131
-
132
-
133
-
134
-
135
-
136
-
137
-
138
-
139
-
140
-
141
-
142
-
143
-
144
-
145
-
146
-
147
-
148
 |
 |

Financials
Vodafone Group Plc Annual Report 2009 95
13. Investments in joint ventures
Principal joint ventures
At 31 March 2009, the Company had the following joint venture undertakings carrying on businesses which affect the profits and assets of the Group. Unless otherwise
stated, the Company’s principal joint ventures all have share capital consisting solely of ordinary shares, which are indirectly held, and the country of incorporation or
registration is also their principal place of operation.
Country of
incorporation Percentage(1)
Name Principal activity or registration shareholdings
Indus Towers Limited Network infrastructure India 21.7(2)
Polkomtel S.A. Network operator Poland 24.4
Vodacom Group (Pty) Limited Holding company South Africa 50.0
Vodafone Fiji Limited Network operator Fiji 49.0(3)
Vodafone Omnitel N.V.(4) Network operator Netherlands 76.9(5)
Notes:
(1) Rounded to nearest tenth of one percent.
(2) Vodafone Essar, in which the Group has a 51.6% equity interest, owns 42.0% of Indus Towers Limited.
(3) The Group holds substantive participating rights which provide it with a veto over the significant financial and operating policies of Vodafone Fiji Limited and which ensure it is able to exercise joint
control over Vodafone Fiji Limited with the majority shareholder.
(4) The principal place of operation of Vodafone Omnitel N.V. is Italy.
(5) The Group considered the existence of substantive participating rights held by the minority shareholder provide that shareholder with a veto right over the significant financial and operating policies
of Vodafone Omnite l N.V., and dete rm ined that, as a res ult of thes e right s, the Group does n ot have contro l over the f inancial and operating policies of Vodafone Omnitel N.V., des pite th e Group’s 76.9%
ownership interest.
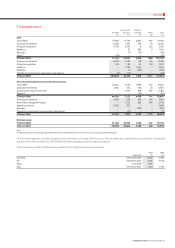
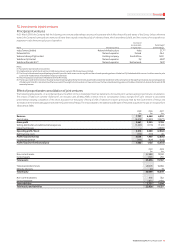
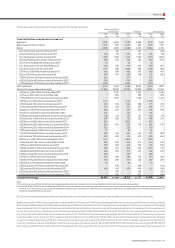
Effect of proportionate consolidation of joint ventures
The following table presents, on a condensed basis, the effect on the consolidated financial statements of including joint ventures using proportionate consolidation.
The results of Safaricom Limited (‘Safaricom’) are included until 28 May 2008, at which time its consolidation status changed from joint venture to associated
undertaking following completion of the share allocation for the public offering of 25% of Safaricom’s shares previously held by the Government of Kenya and
termination of the shareholding agreement with the Government of Kenya. The results related to the additional 4.8% stake in Polkomtel acquired in the year are included from
18 December 2008.
2009 2008 2007
£m £m £m
Revenue 7,737 6,448 6,232
Cost of sales (4,076) (3,225) (3,077)
Gross profit 3,661 3,223 3,155
Selling, distribution and administrative expenses (1,447) (1,155) (1,121)
Impairment losses – – (4,900)
Operating profit/(loss) 2,214 2,068 (2,866)
Net financing costs (170) (119) 46
Profit/(loss) before tax 2,044 1,949 (2,820)
Income tax expense (564) (829) (614)
Profit/(loss) for the financial year 1,480 1,120 (3,434)
2009 2008
£m £m
Non-current assets 22,688 19,102
Current assets 1,148 235
Total assets 23,836 19,337
Total shareholders’ funds 20,079 16,036
Minority interests 20 13
Total equity 20,099 16,049
Non-current liabilities 865 352
Current liabilities 2,872 2,936
Total liabilities 3,737 3,288
Total equity and liabilities 23,836 19,337