Vodafone 2009 Annual Report Download - page 77
Download and view the complete annual report
Please find page 77 of the 2009 Vodafone annual report below. You can navigate through the pages in the report by either clicking on the pages listed below, or by using the keyword search tool below to find specific information within the annual report.-
 1
1 -
2
-
3
-
4
-
5
-
6
-
7
-
8
-
9
-
10
-
11
-
12
-
13
-
14
-
15
-
16
-
17
-
18
-
19
-
20
-
21
-
22
-
23
-
24
-
25
-
26
-
27
-
28
-
29
-
30
-
31
-
32
-
33
-
34
-
35
-
36
-
37
-
38
-
39
-
40
-
41
-
42
-
43
-
44
-
45
-
46
-
47
-
48
-
49
-
50
-
51
-
52
-
53
-
54
-
55
-
56
-
57
-
58
-
59
-
60
-
61
-
62
-
63
-
64
-
65
-
66
-
 67
67 -
 68
68 -
 69
69 -
 70
70 -
 71
71 -
 72
72 -
 73
73 -
 74
74 -
 75
75 -
 76
76 -
 77
77 -
 78
78 -
 79
79 -
 80
80 -
 81
81 -
 82
82 -
 83
83 -
 84
84 -
 85
85 -
 86
86 -
 87
87 -
88
-
89
-
90
-
91
-
92
-
93
-
94
-
95
-
96
-
97
-
98
-
99
-
100
-
101
-
102
-
103
-
104
-
105
-
106
-
107
-
108
-
109
-
110
-
111
-
112
-
113
-
114
-
115
-
116
-
117
-
118
-
119
-
120
-
121
-
122
-
123
-
124
-
125
-
126
-
127
-
128
-
129
-
130
-
131
-
132
-
133
-
134
-
135
-
136
-
137
-
138
-
139
-
140
-
141
-
142
-
143
-
144
-
145
-
146
-
147
-
148
 |
 |

Financials
Vodafone Group Plc Annual Report 2009 75
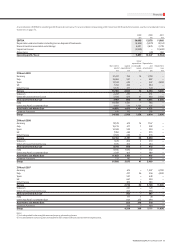
Consolidated balance sheet
2009 2008
Note £m £m
Non-current assets
Goodwill 9 53,958 51,336
Other intangible assets 9 20,980 18,995
Property, plant and equipment 11 19,250 16,735
Investments in associated undertakings 14 34,715 22,545
Other investments 15 7,060 7,367
Deferred tax assets 6 630 436
Post employment benefits 26 8 65
Trade and other receivables 17 3,069 1,067
139,670 118,546
Current assets
Inventory 16 412 417
Taxation recoverable 77 57
Trade and other receivables 17 7,662 6,551
Cash and cash equivalents 18 4,878 1,699
13,029 8,724
Total assets 152,699 127,270
Equity
Called up share capital 19 4,153 4,182
Share premium account 21 43,008 42,934
Own shares held 21 (8,036) (7,856)
Additional paid-in capital 21 100,239 100,151
Capital redemption reserve 21 10,101 10,054
Accumulated other recognised income and expense 22 20,517 10,558
Retained losses 23 (83,820) (81,980)
Total equity shareholders’ funds 86,162 78,043
Minority interests 1,787 1,168
Written put options over minority interests (3,172) (2,740)
Total minority interests (1,385) (1,572)
Total equity 84,777 76,471
Non-current liabilities
Long term borrowings 25 31,749 22,662
Deferred tax liabilities 6 6,642 5,109
Post employment benefits 26 240 104
Provisions 27 533 306
Trade and other payables 28 811 645
39,975 28,826
Current liabilities
Short term borrowings 25, 35 9,624 4,532
Current taxation liabilities 4,552 5,123
Provisions 27 373 356
Trade and other payables 28 13,398 11,962
27,947 21,973
Total equity and liabilities 152,699 127,270
The consolidated financial statements were approved by the Board of directors on 19 May 2009 and were signed on its behalf by:
Vittorio Colao Andy Halford
Chief Executive Chief Financial Officer
The accompanying notes are an integral part of these consolidated financial statements.
at 31 March