Vodafone 2009 Annual Report Download - page 94
Download and view the complete annual report
Please find page 94 of the 2009 Vodafone annual report below. You can navigate through the pages in the report by either clicking on the pages listed below, or by using the keyword search tool below to find specific information within the annual report.-
 1
1 -
2
-
3
-
4
-
5
-
6
-
7
-
8
-
9
-
10
-
11
-
12
-
13
-
14
-
15
-
16
-
17
-
18
-
19
-
20
-
21
-
22
-
23
-
24
-
25
-
26
-
27
-
28
-
29
-
30
-
31
-
32
-
33
-
34
-
35
-
36
-
37
-
38
-
39
-
40
-
41
-
42
-
43
-
44
-
45
-
46
-
47
-
48
-
49
-
50
-
51
-
52
-
53
-
54
-
55
-
56
-
57
-
58
-
59
-
60
-
61
-
62
-
63
-
64
-
65
-
66
-
67
-
68
-
69
-
70
-
71
-
72
-
73
-
74
-
75
-
76
-
77
-
78
-
79
-
80
-
81
-
82
-
83
-
 84
84 -
 85
85 -
 86
86 -
 87
87 -
 88
88 -
 89
89 -
 90
90 -
 91
91 -
 92
92 -
 93
93 -
 94
94 -
 95
95 -
 96
96 -
 97
97 -
 98
98 -
 99
99 -
 100
100 -
 101
101 -
 102
102 -
 103
103 -
 104
104 -
105
-
106
-
107
-
108
-
109
-
110
-
111
-
112
-
113
-
114
-
115
-
116
-
117
-
118
-
119
-
120
-
121
-
122
-
123
-
124
-
125
-
126
-
127
-
128
-
129
-
130
-
131
-
132
-
133
-
134
-
135
-
136
-
137
-
138
-
139
-
140
-
141
-
142
-
143
-
144
-
145
-
146
-
147
-
148
 |
 |

92 Vodafone Group Plc Annual Report 2009
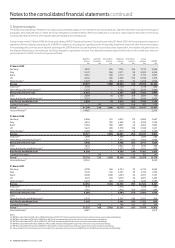
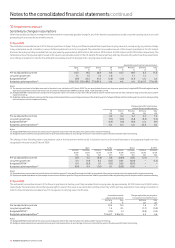
10. Impairment continued
Sensitivity to changes in assumptions
Other than as disclosed below, management believes that no reasonably possible change in any of the above key assumptions would cause the carrying value of any cash
generating unit to exceed its recoverable amount.
31 March 2009
The estimated recoverable amount of the Group’s operations in Spain, Turkey and Ghana equalled their respective carrying value and, consequently, any adverse change
in key assumption would, in isolation, cause a further impairment loss to be recognised. The estimated recoverable amount of the Group’s operations in the UK, Ireland,
Romania, Germany and Italy exceeded their carrying value by approximately £900 million, £60 million, £300 million, £9,250 million and £2,200 million respectively. The
tables below show the key assumptions used in the value in use calculation and, for the UK, Ireland, Romania, Germany and Italy, the amount by which each key assumption
must change in isolation in order for the estimated recoverable amount to be equal to its carrying value in both cases.
Assumptions used in value in use calculation
Spain Turkey(1) Ghana UK Ireland Romania Germany Italy
% % % % % % % %
Pre-tax adjusted discount rate 10.3 19.5 26.9 8.6 10.2 14.8 8.5 11.8
Long term growth rate 1.1 7.5 7.3 1.0 − 1.1 1.1 −
Budgeted EBITDA(2) (3.9) 22.3 37.2 (2.8) (3.5) (3.1) n/a 2.2
Budgeted capital expenditure(3) 9.1 to 11.8 8.2 to 69.8 7.7 to 91.6 n/a n/a n/a 5.5 to 9.7 7.7 to 9.9
Notes:
(1) The assumptions listed in the table were used in the value in use calculation at 31 March 2009. The pre-tax adjusted discount rate, long term growth rate, budgeted EBITDA and budgeted capital
expenditure assumptions used in the value in use calculation at 30 September 2008 were 18.6%, 10.0%, 13.1% and 8.2% to 54.7%.
(2) Budgeted EBITDA is expressed as the compound annual growth rates in the initial ten years for Turkey and Ghana and the initial five years for all other cash generating units of the plans used for
impairment testing.
(3) B ud geted cap it al ex pe nditure is exp ressed as t he ra ng e of capit al ex pe nditure as a p erc ent age of reven ue in the ini tial ten year s for Tur key and Gh ana an d the ini tial f ive years for all other cash g eneratin g
units of the plans used for impairment testing.
Change required for carrying value
to equal the recoverable amount
UK Ireland Romania Germany Italy
pps pps pps pps pps
Pre-tax adjusted discount rate 0.9 0.2 2.2 3.3 1.4
Long term growth rate (1.1) (0.3) (3.4) (3.9) (1.5)
Budgeted EBITDA(1) (6.9) (1.6) (9.0) n/a (9.1)
Budgeted capital expenditure(2) n/a n/a n/a 23.8 8.5
Notes:
(1) Budgeted EBITDA is expressed as the compound annual growth rates in the initial five years of the plans used for impairment testing.
(2) Budgeted capital expenditure is expressed as the range of capital expenditure as a percentage of revenue in the initial five years of the plans used for impairment testing.
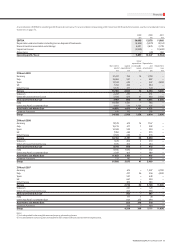
The changes in the following table to assumptions used in the impairment review would, in isolation, lead to an (increase)/decrease to the aggregate impairment loss
recognised in the year ended 31 March 2009:
Spain Turkey Ghana All other
Increase Decrease Increase Decrease Increase Decrease Increase Decrease
by 2% by 2% by 2% by 2% by 2% by 2% by 2% by 2%
£bn £bn £bn £bn £bn £bn £bn £bn
Pre-tax adjusted discount rate (2.1) 3.3 (0.4) 0.6 (0.04) 0.05 (2.1) –
Long term growth rate 3.4 (1.9) 0.3 (0.2) 0.01 (0.01) – (1.5)
Budgeted EBITDA(1) 0.4 (0.3) 0.1 (0.1) 0.02 (0.01) – –
Budgeted capital expenditure(2) (0.4) 0.4 (0.1) 0.1 (0.02) 0.02 – –
Notes:
(1) Represents the compound annual growth rate for the initial ten years for Turkey and Ghana and the initial five years for all other cash generating units of the plans used for impairment testing.
(2) Represents capital expenditure as a percentage of revenue in the initial ten years for Turkey and Ghana and the initial five years for all other cash generating units of the plans used for impairment testing.
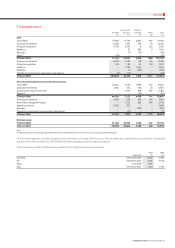
31 March 2008
The estimated recoverable amount of the Group’s operations in Germany and Italy exceeded their carrying value by approximately £2,700 million and £3,400 million
respectively. The table below shows the key assumptions used in the value in use calculation and the amount by which each key assumption must change in isolation in
order for the estimated recoverable amount to be equal to its carrying value in both cases.
Assumptions used in Change required for carrying value
value in use calculation to equal the recoverable amount
Germany Italy Germany Italy
% % pps pps
Pre-tax adjusted discount rate 10.2 11.5 1.6 2.7
Long term growth rate 1.2 0.1 (1.7) (3.0)
Budgeted EBITDA(1) (2.2) 1.4 (2.0) (4.2)
Budgeted capital expenditure(2) 7.5 to 8.7 5.8 to 9.5 4.2 6.6
Notes:
(1) Budgeted EBITDA is expressed as the compound annual growth rates in the initial five years of the plans used for impairment testing.
(2) Budgeted capital expenditure is expressed as the range of capital expenditure as a percentage of revenue in the initial five years of the plans used for impairment testing.
Notes to the consolidated nancial statements continued