Vodafone 2009 Annual Report Download - page 32
Download and view the complete annual report
Please find page 32 of the 2009 Vodafone annual report below. You can navigate through the pages in the report by either clicking on the pages listed below, or by using the keyword search tool below to find specific information within the annual report.-
 1
1 -
2
-
3
-
4
-
5
-
6
-
7
-
8
-
9
-
10
-
11
-
12
-
13
-
14
-
15
-
16
-
17
-
18
-
19
-
20
-
21
-
 22
22 -
 23
23 -
 24
24 -
 25
25 -
 26
26 -
 27
27 -
 28
28 -
 29
29 -
 30
30 -
 31
31 -
 32
32 -
 33
33 -
 34
34 -
 35
35 -
 36
36 -
 37
37 -
 38
38 -
 39
39 -
 40
40 -
 41
41 -
 42
42 -
43
-
44
-
45
-
46
-
47
-
48
-
49
-
50
-
51
-
52
-
53
-
54
-
55
-
56
-
57
-
58
-
59
-
60
-
61
-
62
-
63
-
64
-
65
-
66
-
67
-
68
-
69
-
70
-
71
-
72
-
73
-
74
-
75
-
76
-
77
-
78
-
79
-
80
-
81
-
82
-
83
-
84
-
85
-
86
-
87
-
88
-
89
-
90
-
91
-
92
-
93
-
94
-
95
-
96
-
97
-
98
-
99
-
100
-
101
-
102
-
103
-
104
-
105
-
106
-
107
-
108
-
109
-
110
-
111
-
112
-
113
-
114
-
115
-
116
-
117
-
118
-
119
-
120
-
121
-
122
-
123
-
124
-
125
-
126
-
127
-
128
-
129
-
130
-
131
-
132
-
133
-
134
-
135
-
136
-
137
-
138
-
139
-
140
-
141
-
142
-
143
-
144
-
145
-
146
-
147
-
148
 |
 |

30 Vodafone Group Plc Annual Report 2009
Operating results continued
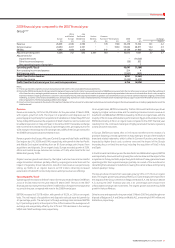
India
Revenue grew by 33% on a pro forma basis, with growth in the fourth quarter of 27.7%
at constant exchange rates. Growth in the fourth quarter remained stable in
comparison to the third quarter as the eight percentage point benefit of the new
revenue stream from the network sharing joint venture, Indus Towers, which
launched during the first half of the year, offset the slowing underlying growth rate.
Visitor revenue increased, albeit at a lower rate, due to the impact of economic
pressures as people travel less. Lower effective rates per minute reflecting price
reductions earlier in the year, coupled with the continued market shift to lifetime
validity prepaid offerings, led to a reduction in customer churn. The lower effective
rate and a slight fall in usage per customer were mitigated by net customer additions,
which averaged 2.1 million per month, and the launch of services in seven new circles,
bringing the closing customer base to 68.8 million. Customer penetration in the
Indian mobile market reached 34% at 31 March 2009.
EBITDA grew by 5% on a pro forma basis. Customer costs as a percentage of revenue
decreased, benefiting from economies of scale. Licensing costs increased as
discounts received from the regulator in some service areas were terminated.
Network expansion continued, with an average of 2,600 base stations constructed
per month, primarily in the new circles. Site sharing increased and Indus Towers
steadily increased its operations throughout the rest of the year, with 95,000 sites
under its management at the end of March 2009.
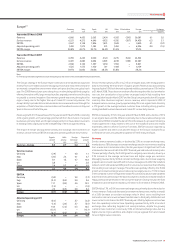
Other Asia Pacific and Middle East
The organic increase in service revenue of 8.5% was attributable to performances in
Egypt and Australia. In Egypt, service revenue grew by 11.9% at constant exchange
rates, as growth in the customer base and increased usage per customer were partially
offset by a decline in the effective rate per minute as a result of the introduction of new
tariffs in addition to lower termination rates and a fall in both visitor revenue and the
enterprise segment revenue as people travelled less. Service revenue in Australia
increased by 6.1% on an organic basis, due to an increase in the average customer base
and good data revenue growth, especially in mobile broadband services. These were
partially offset by lower ARPU, reflecting strong competition, which led to a lower
revenue growth rate in the fourth quarter. In New Zealand, service revenue grew by
4.9% at constant exchange rates, a result of an increase in the fixed broadband cus tomer
base and growth in data services, the latter following increased penetration of mobile
PC connectivity devices. These benefits were partially offset by the competitive and
recessionary trends in the market.
EBITDA grew organically by 7.3%, with a decline in the EBITDA margin, as the increase
in Egypt was offset by the decline in Australia. Egypt’s EBITDA grew by 15.9% at constant
exchange rates in proportion to revenue, with a slight increase in margin, despite the
inclusion of 3G licensing fees for the full year in comparison to only part of the prior year.
In Australia, EBITDA decreased by 17.6% on an organic basis, primarily due to a loss
provision related to a prepaid recharge vendor and an increased focus on contract
customers resulting in higher customer costs.
In February 2009, the Group and Hutchison Telecommunications (Australia) Limited
agreed to merge their Australian operations to form a 50:50 joint venture. The
transaction is expected to complete in the first half of the 2010 financial year. Following
completion, the joint venture will be proportionately consolidated.
On 10 May 2009, Vodafone Qatar completed a public offering of 40% of its authorised
share capital, raising QAR 3.4 billion (£0.6 billion). The shares are expected to be listed
on the Doha securities market by July 2009.
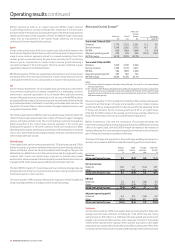
Verizon Wireless
2009 2008 % change
£m £m £ Organic
Revenue 14,085 10,144 38.9 10.4
Service revenue 12,862 9,246 39.1 10.5
EBITDA 5,543 3,930 41.0 13.0
Interest (217) (102) 100+
Tax(1) (198) (166) 19.3
Minority interest (78) (56) 39.3
Discontinued operations 57 – –
Group share of result in
Verizon Wireless 3,542 2,447 44.7 21.6
Note:
(1) The Group’s share of the tax attributable to Verizon Wireless relates only to the corporate entities
held by the Verizon Wireless partnership and certain state taxes which are levied on the
partnership. The tax attributable to the Group’s share of the partnership’s pre-tax profit is
included within the Group tax charge.
Verizon Wireless, the Group’s associated undertaking in the US, achieved 5.6 million
net customer additions in a market where penetration reached an estimated 92%
at 31 March 2009. The increased closing customer base of 86.6 million was
achieved through continued strong organic growth, the acquisitions of Rural
Cellular Corporation and Alltel, combined with concentration on the high value
contract segment and market leading customer loyalty as evidenced by low
customer churn.
Service revenue growth was 10.5% on an organic basis, driven by the expanding
customer base and robust messaging and data ARPU. Messaging and data revenue
continued to increase strongly, predominantly as a result of growth in data card,
email and messaging services. Verizon Wireless continued to extend the reach
of its 3G network, which now covers more than 280 million people after the
Alltel acquisition.
Verizon Wireless improved its EBITDA margin to 39.4% through efficiencies in
operating expenses partly offset by a higher level of customer acquisition and
retention costs, driven by increased demand for high end data devices such as the
BlackBerry Storm.
Verizon Wireless completed the acquisition of Rural Cellular Corporation in the first
half of the financial year, adding 0.7 million customers. On 9 January 2009, Verizon
Wireless completed its acquisition of Alltel, purchasing Alltel’s equity and acquiring
and repaying Alltel’s debt with Verizon Wireless and Alltel cash as well as the proceeds
from capital market transactions. The Alltel acquisition added 13.2 million customers
before required divestitures. Verizon Wireless expects to realise synergies with a net
present value, after integration costs, of more than US$9 billion, driven by aggregate
capital and operating expense savings. Increased debt in relation to the acquisition
of Alltel led to a £150 million interest charge for the quarter ended 31 March 2009.
As part of regulatory approval for the Alltel acquisition, Verizon Wireless is required
to divest overlapping properties in 105 markets, corresponding to 2.2 million
customers. On 8 May 2009, Verizon Wireless announced an agreement with AT&T,
which will acquire the network assets and mobile licences of 79 of these markets,
corresponding to 1.5 million of these customers, for $2.35 billion.