Vodafone 2009 Annual Report Download - page 91
Download and view the complete annual report
Please find page 91 of the 2009 Vodafone annual report below. You can navigate through the pages in the report by either clicking on the pages listed below, or by using the keyword search tool below to find specific information within the annual report.-
 1
1 -
2
-
3
-
4
-
5
-
6
-
7
-
8
-
9
-
10
-
11
-
12
-
13
-
14
-
15
-
16
-
17
-
18
-
19
-
20
-
21
-
22
-
23
-
24
-
25
-
26
-
27
-
28
-
29
-
30
-
31
-
32
-
33
-
34
-
35
-
36
-
37
-
38
-
39
-
40
-
41
-
42
-
43
-
44
-
45
-
46
-
47
-
48
-
49
-
50
-
51
-
52
-
53
-
54
-
55
-
56
-
57
-
58
-
59
-
60
-
61
-
62
-
63
-
64
-
65
-
66
-
67
-
68
-
69
-
70
-
71
-
72
-
73
-
74
-
75
-
76
-
77
-
78
-
79
-
80
-
 81
81 -
 82
82 -
 83
83 -
 84
84 -
 85
85 -
 86
86 -
 87
87 -
 88
88 -
 89
89 -
 90
90 -
 91
91 -
 92
92 -
 93
93 -
 94
94 -
 95
95 -
 96
96 -
 97
97 -
 98
98 -
 99
99 -
 100
100 -
 101
101 -
102
-
103
-
104
-
105
-
106
-
107
-
108
-
109
-
110
-
111
-
112
-
113
-
114
-
115
-
116
-
117
-
118
-
119
-
120
-
121
-
122
-
123
-
124
-
125
-
126
-
127
-
128
-
129
-
130
-
131
-
132
-
133
-
134
-
135
-
136
-
137
-
138
-
139
-
140
-
141
-
142
-
143
-
144
-
145
-
146
-
147
-
148
 |
 |

Financials
Vodafone Group Plc Annual Report 2009 89
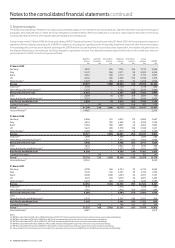
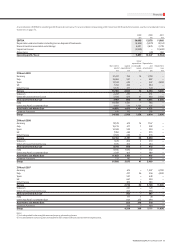
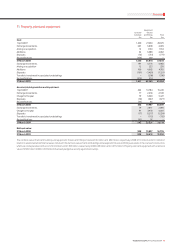
9. Intangible assets
Licences and Computer
Goodwill spectrum software Other Total
£m £m £m £m £m
Cost:
1 April 2007 75,068 17,256 4,305 865 97,494
Exchange movements 12,406 1,707 573 59 14,745
Arising on acquisition 4,316 3,045 8 256 7,625
Additions – 33 993 8 1,034
Disposals – (1) (79) – (80)
Other(1) (28) – – – (28)
31 March 2008 91,762 22,040 5,800 1,188 120,790
Exchange movements 14,298 2,778 749 153 17,978
Arising on acquisition 613 199 69 130 1,011
Additions – 1,138 1,144 – 2,282
Disposals – (1) (403) – (404)
Transfer to investments in associated undertakings (9) (16) – – (25)
31 March 2009 106,664 26,138 7,359 1,471 141,632
Accumulated impairment losses and amortisation:
1 April 2007 34,501 3,356 2,989 376 41,222
Exchange movements 5,925 433 436 28 6,822
Amortisation charge for the year – 1,343 802 337 2,482
Disposals – – (67) – (67)
31 March 2008 40,426 5,132 4,160 741 50,459
Exchange movements 6,630 659 569 126 7,984
Amortisation charge for the year – 1,522 885 346 2,753
Impairment losses 5,650 250 – – 5,900
Disposals – – (391) – (391)
Transfers to investments in associated undertakings – (11) – – (11)
31 March 2009 52,706 7,552 5,223 1,213 66,694
Net book value:
31 March 2008 51,336 16,908 1,640 447 70,331
31 March 2009 53,958 18,586 2,136 258 74,938
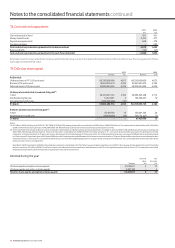
Note:
(1) Represents a pre-tax charge against goodwill offsetting the tax benefit arising on recognition of a pre-acquisition deferred tax asset.
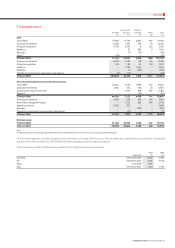
For licences and spectrum and other intangible assets, amortisation is included within the cost of sales line within the consolidated income statement. Licences and
spectrum with a net book value of £2,765m (2008: £nil) have been pledged as security against borrowings.
The net book value at 31 March 2009 and expiry dates of the most significant licences are as follows:
2009 2008
Expiry date £m £m
Germany December 2020 5,452 5,089
UK December 2021 4,246 4,579
Qatar June 2028 1,482 –
Italy December 2021 1,240 1,150