Vodafone 2009 Annual Report Download - page 111
Download and view the complete annual report
Please find page 111 of the 2009 Vodafone annual report below. You can navigate through the pages in the report by either clicking on the pages listed below, or by using the keyword search tool below to find specific information within the annual report.-
 1
1 -
2
-
3
-
4
-
5
-
6
-
7
-
8
-
9
-
10
-
11
-
12
-
13
-
14
-
15
-
16
-
17
-
18
-
19
-
20
-
21
-
22
-
23
-
24
-
25
-
26
-
27
-
28
-
29
-
30
-
31
-
32
-
33
-
34
-
35
-
36
-
37
-
38
-
39
-
40
-
41
-
42
-
43
-
44
-
45
-
46
-
47
-
48
-
49
-
50
-
51
-
52
-
53
-
54
-
55
-
56
-
57
-
58
-
59
-
60
-
61
-
62
-
63
-
64
-
65
-
66
-
67
-
68
-
69
-
70
-
71
-
72
-
73
-
74
-
75
-
76
-
77
-
78
-
79
-
80
-
81
-
82
-
83
-
84
-
85
-
86
-
87
-
88
-
89
-
90
-
91
-
92
-
93
-
94
-
95
-
96
-
97
-
98
-
99
-
100
-
 101
101 -
 102
102 -
 103
103 -
 104
104 -
 105
105 -
 106
106 -
 107
107 -
 108
108 -
 109
109 -
 110
110 -
 111
111 -
 112
112 -
 113
113 -
 114
114 -
 115
115 -
 116
116 -
 117
117 -
 118
118 -
 119
119 -
 120
120 -
 121
121 -
122
-
123
-
124
-
125
-
126
-
127
-
128
-
129
-
130
-
131
-
132
-
133
-
134
-
135
-
136
-
137
-
138
-
139
-
140
-
141
-
142
-
143
-
144
-
145
-
146
-
147
-
148
 |
 |

Financials
Vodafone Group Plc Annual Report 2009 109
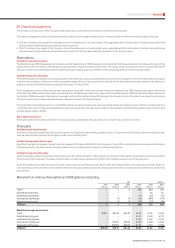
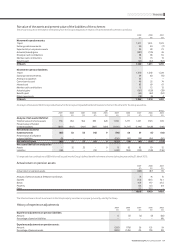
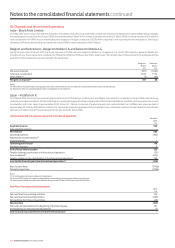
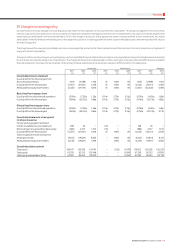
Fair value of the assets and present value of the liabilities of the schemes
The amount included in the balance sheet arising from the Group’s obligations in respect of its defined benefit schemes is as follows:
2009 2008 2007
£m £m £m
Movement in pension assets:
1 April 1,271 1,251 1,123
Exchange rate movements 50 50 (7)
Expected return on pension assets 92 89 73
Actuarial (losses)/gains (381) (176) 26
Employer cash contributions 98 86 55
Member cash contributions 15 13 13
Benefits paid (45) (42) (32)
31 March 1,100 1,271 1,251
Movement in pension liabilities:
1 April 1,310 1,292 1,224
Exchange rate movements 69 60 (13)
Arising on acquisition 33 – –
Current service cost 46 53 74
Interest cost 83 69 61
Member cash contributions 15 13 13
Actuarial gains (161) (129) (39)
Benefits paid (45) (42) (32)
Other movements (18) (6) 4
31 March 1,332 1,310 1,292
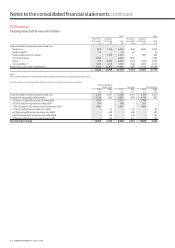
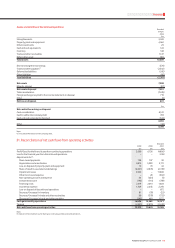
An analysis of net assets/(deficits) is provided below for the Group’s principal defined benefit pension scheme in the UK and for the Group as a whole.
UK Group
2009 2008 2007 2006 2005 2009 2008 2007 2006 2005
£m £m £m £m £m £m £m £m £m £m
Analysis of net assets/(deficits):
Total fair value of scheme assets 755 934 954 835 628 1,100 1,271 1,251 1,123 874
Present value of funded
scheme liabilities (815) (902) (901) (847) (619) (1,196) (1,217) (1,194) (1,128) (918)
Net (deficit)/assets for
funded schemes (60) 32 53 (12) 9 (96) 54 57 (5) (44)
Present value of unfunded
scheme liabilities (8) − − − − (136) (93) (98) (96) (80)
Net (deficit)/assets (68) 32 53 (12) 9 (232) (39) (41) (101) (124)
Net assets/(deficit) are analysed as:
Assets − 32 53 − 9 8 65 82 19 12
Liabilities (68) − − (12) − (240) (104) (123) (120) (136)
It is expected that contributions of £88 million will be paid into the Group’s defined benefit retirement schemes during the year ending 31 March 2010.
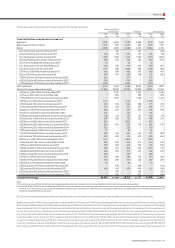
Actual return on pension assets
2009 2008 2007
£m £m £m
Actual return on pension assets (289) (87) 99
Analysis of pension assets at 31 March is as follows: % % %
Equities 55.6 68.5 72.1
Bonds 41.9 17.7 27.5
Property 0.4 0.3 0.4
Other 2.1 13.5 −
100.0 100.0 100.0
The schemes have no direct investments in the Group’s equity securities or in property currently used by the Group.
History of experience adjustments
2009 2008 2007 2006 2005
£m £m £m £m £m
Experience adjustments on pension liabilities:
Amount 6 (5) (2) (4) (60)
Percentage of pension liabilities − − − − 6%
Experience adjustments on pension assets:
Amount (381) (176) 26 121 24
Percentage of pension assets (35%) (14%) 2% 11% 3%