Vodafone 2009 Annual Report Download - page 121
Download and view the complete annual report
Please find page 121 of the 2009 Vodafone annual report below. You can navigate through the pages in the report by either clicking on the pages listed below, or by using the keyword search tool below to find specific information within the annual report.-
 1
1 -
2
-
3
-
4
-
5
-
6
-
7
-
8
-
9
-
10
-
11
-
12
-
13
-
14
-
15
-
16
-
17
-
18
-
19
-
20
-
21
-
22
-
23
-
24
-
25
-
26
-
27
-
28
-
29
-
30
-
31
-
32
-
33
-
34
-
35
-
36
-
37
-
38
-
39
-
40
-
41
-
42
-
43
-
44
-
45
-
46
-
47
-
48
-
49
-
50
-
51
-
52
-
53
-
54
-
55
-
56
-
57
-
58
-
59
-
60
-
61
-
62
-
63
-
64
-
65
-
66
-
67
-
68
-
69
-
70
-
71
-
72
-
73
-
74
-
75
-
76
-
77
-
78
-
79
-
80
-
81
-
82
-
83
-
84
-
85
-
86
-
87
-
88
-
89
-
90
-
91
-
92
-
93
-
94
-
95
-
96
-
97
-
98
-
99
-
100
-
101
-
102
-
103
-
104
-
105
-
106
-
107
-
108
-
109
-
110
-
 111
111 -
 112
112 -
 113
113 -
 114
114 -
 115
115 -
 116
116 -
 117
117 -
 118
118 -
 119
119 -
 120
120 -
 121
121 -
 122
122 -
 123
123 -
 124
124 -
 125
125 -
 126
126 -
 127
127 -
 128
128 -
 129
129 -
 130
130 -
 131
131 -
132
-
133
-
134
-
135
-
136
-
137
-
138
-
139
-
140
-
141
-
142
-
143
-
144
-
145
-
146
-
147
-
148
 |
 |

Financials
Vodafone Group Plc Annual Report 2009 119
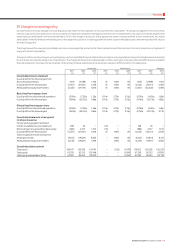
39. Change in accounting policy
During the year, the Group changed its accounting policy with respect to the acquisition of minority interests in subsidiaries. The Group now applies the economic entity
method, under which such transactions are accounted for as transactions between shareholders and there is no remeasurement to fair value of net assets acquired that
were previously attributable to minority shareholders. Prior to this change in policy, the Group applied the parent company method to such transactions, and assets
attributable to minority interests immediately prior to the respective acquisition, including goodwill and other acquired intangible assets, were remeasured to fair value at
the date of acquisition.
The Group believes the new policy is preferable as it more closely aligns the accounting for these transactions with the treatment of minority interest as a component of
equity and will aid comparability.
The impact of this voluntary change in accounting policy on the consolidated financial statements is primarily to reduce goodwill and acquired intangible assets and related
income statement amounts arising on such transactions. This change did not result in a material impact on the current year or any years included within these consolidated
financial statements. The impact on each line item of the primary financial statements since the Group’s adoption of IFRS is shown in the table below:
As reported Adjustments Restated
2007 2006 2005 2007 2006 2005 2007 2006 2005
£m £m £m £m £m £m £m £m £m
Consolidated income statement
(Loss)/profit for the financial year from
discontinued operations (491) (4,588) 1,102 75 1,690 80 (416) (2,898) 1,182
(Loss)/profit for the financial year (5,297) (21,821) 6,518 75 1,690 80 (5,222) (20,131) 6,598
Attributable to equity shareholders (5,426) (21,916) 6,410 75 1,690 80 (5,351) (20,226) 6,490
Basic (loss)/earnings per share
(Loss)/profit from discontinued operations (0.90)p (7.35)p 1.56p 0.14p 2.70p 0.12p (0.76)p (4.65)p 1.68p
(Loss)/profit for the financial year (9.84)p (35.01)p 9.68p 0.14p 2.70p 0.12p (9.70)p (32.31)p 9.80p
Diluted (loss)/earnings per share
(Loss)/profit from discontinued operations (0.90)p (7.35)p 1.56p 0.14p 2.70p 0.12p (0.76)p (4.65)p 1.68p
(Loss)/profit for the financial year (9.84)p (35.01)p 9.65p 0.14p 2.70p 0.12p (9.70)p (32.31)p 9.77p
Consolidated statement of recognised
income and expense
Foreign exchange gains transferred
to the consolidated income statement 838 36 − (75) − − 763 36 −
Net (loss)/gain recognised directly in equity (808) 2,317 1,515 (75) − − (883) 2,317 1,515
(Loss)/profit for the financial year (5,297) (21,821) 6,518 75 1,690 80 (5,222) (20,131) 6,598
Total recognised income and expense
relating to the year (6,105) (19,504) 8,033 − 1,690 80 (6,105) (17,814) 8,113
Attributable to equity shareholders (6,210) (19,607) 7,958 − 1,690 80 (6,210) (17,917) 8,038
Consolidated balance sheet
Total assets 109,617 126,738 147,197 − (236) (1,979) 109,617 126,502 145,218
Total equity 67,293 85,312 113,648 − − (1,690) 67,293 85,312 111,958
Total equity shareholders’ funds 67,067 85,425 113,800 − − (1,690) 67,067 85,425 112,110