Vodafone 2009 Annual Report Download - page 31
Download and view the complete annual report
Please find page 31 of the 2009 Vodafone annual report below. You can navigate through the pages in the report by either clicking on the pages listed below, or by using the keyword search tool below to find specific information within the annual report.-
 1
1 -
2
-
3
-
4
-
5
-
6
-
7
-
8
-
9
-
10
-
11
-
12
-
13
-
14
-
15
-
16
-
17
-
18
-
19
-
20
-
 21
21 -
 22
22 -
 23
23 -
 24
24 -
 25
25 -
 26
26 -
 27
27 -
 28
28 -
 29
29 -
 30
30 -
 31
31 -
 32
32 -
 33
33 -
 34
34 -
 35
35 -
 36
36 -
 37
37 -
 38
38 -
 39
39 -
 40
40 -
 41
41 -
42
-
43
-
44
-
45
-
46
-
47
-
48
-
49
-
50
-
51
-
52
-
53
-
54
-
55
-
56
-
57
-
58
-
59
-
60
-
61
-
62
-
63
-
64
-
65
-
66
-
67
-
68
-
69
-
70
-
71
-
72
-
73
-
74
-
75
-
76
-
77
-
78
-
79
-
80
-
81
-
82
-
83
-
84
-
85
-
86
-
87
-
88
-
89
-
90
-
91
-
92
-
93
-
94
-
95
-
96
-
97
-
98
-
99
-
100
-
101
-
102
-
103
-
104
-
105
-
106
-
107
-
108
-
109
-
110
-
111
-
112
-
113
-
114
-
115
-
116
-
117
-
118
-
119
-
120
-
121
-
122
-
123
-
124
-
125
-
126
-
127
-
128
-
129
-
130
-
131
-
132
-
133
-
134
-
135
-
136
-
137
-
138
-
139
-
140
-
141
-
142
-
143
-
144
-
145
-
146
-
147
-
148
 |
 |

Performance
Vodafone Group Plc Annual Report 2009 29
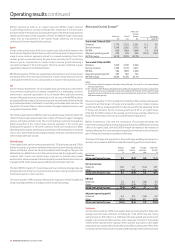
than average ARPU. Data revenue grew by 59.7% at constant exchange rates, as the
higher revenue base partially offset the benefit from increased penetration of mobile
PC connectivity devices, with the absence of fixed line alternatives making mobile
data a popular offering. Relatively low contract voice revenue growth resulted from
reduced out of bundle usage as customers cut back on spending due to economic
conditions. Equipment revenue was adversely impacted by consumer preference for
lower value handsets. Trading conditions in the Democratic Republic of Congo (‘DRC’)
have worsened significantly due to the impact of lower commodity prices on mining
which is central to the DRC’s economy.
Organic EBITDA growth was 7.3%, despite lower margins, as the growth in revenue
more than offset the increasing cost base, which benefited from stable customer
costs as a percentage of revenue as the South African market matures. The cost base
was adversely impacted by an increase in operating expenses due to continued
expansion, investment in enterprise services, Black Economic Empowerment share
charges and high wage inflation.
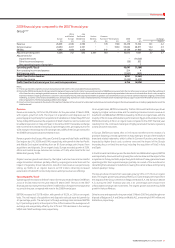
On 30 December 2008, Vodacom acquired the carrier services and business network
solutions subsidiaries (‘Gateway’) from Gateway Telecommunications SA (Pty) Ltd.
Gateway provides services in more than 40 countries in Africa. On 20 April 2009, the
Group acquired an additional 15.0% stake in Vodacom and on 18 May 2009, Vodacom
became a subsidiary undertaking following the termination of the shareholder
agreement with Telkom SA Limited, the seller and previous joint venture partner.
Other Africa and Central Europe
Service revenue declined by 0.9% on an organic basis, due to the performance in
Turkey combined with the impact of deteriorating economic conditions across
Central Europe, most notably in Romania in the fourth quarter. At constant exchange
rates, service revenue in Turkey decreased by 7.6%, with an 18.4% fall in the fourth
quarter. Termination rate cuts adversely impacted revenue by 6.9% and revenue was
further depressed by a higher rate of churn and a decline in prepaid ARPU due to
intense competition in the market. Consumer confidence in Turkey fell with the
deterioration in the macroeconomic environment, impacting revenue. Competition
also intensified, with the launch of mobile number portability in November 2008
leading to aggressive acquisition and pricing campaigns, especially in the fourth
quarter of the year. Mobile ARPU fell in the second half of the year but stabilised in
the fourth quarter following successful promotions. In Romania, service revenue
grew by 1.1% at constant exchange rates, but deteriorated during the year, with a
10.3% decline in the fourth quarter at constant exchange rates. The market continues
to mature, with the decline in ARPU resulting from local currency devaluation against
the euro – whilst tariffs are quoted in euros household incomes are earned in local
currency – in addition to market led price reductions impacting performance in the
fourth quarter in particular. These effects were partially offset by data revenue
growth following successful data promotions and flexible access offers, which led to
a rise in the number of mobile PC connectivity devices.
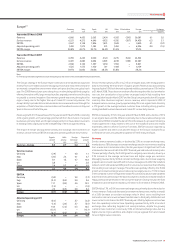
On an organic basis, EBITDA decreased by 7.0%, with the EBITDA margin also declining
due to the fall in revenue and investment in the turnaround plan in Turkey. EBITDA in
Turkey declined by 37.3% at constant exchange rates, as a result of the decline in
revenue and increased operating expenses, reflecting higher marketing costs, higher
technology costs due to expansion of the network and organisational restructuring
as part of the turnaround plan. In Romania, EBITDA decreased by 4.0% at constant
exchange rates, as aggressive market competition and higher gross customer
additions led to the rise in the cost of acquiring and retaining customers.
In May 2008, the Group changed the consolidation status of Safaricom from a joint
venture to an associated undertaking, following completion of the share allocation
for the public offering of 25.0% of Safaricom’s shares previously held by the
Government of Kenya and termination of the shareholders’ agreement with the
Government of Kenya. In August 2008, the Group acquired 70.0% of Ghana
Telecommunications Company Limited, which offers both mobile and fixed
services. The Group also increased its stake in Polkomtel from 19.6% to 24.4% in
December 2008.
Asia Pacic and Middle East(1)
Asia Pacific
and Middle
India Other Eliminations East % change
£m £m £m £m £ Organic
Year ended
31 March 2009
Revenue 2,689 3,131 (1) 5,819 32.3 9.3
Service revenue 2,604 2,831 (1) 5,434 32.5 8.5
EBITDA 710 1,029 − 1,739 17.8 7.3
Adjusted
operating profit (37) 562 − 525 (0.9) 6.6
EBITDA margin 26.4% 32.9% 29.9%
Year ended
31 March 2008
Revenue 1,822 2,577 − 4,399
Service revenue 1,753 2,348 − 4,101
EBITDA 598 878 − 1,476
Adjusted
operating profit 35 495 − 530
EBITDA margin 32.8% 34.1% 33.6%
Note:
(1) The Group revised its segment structure during the year. See note 3 to the consolidated
financial statements.
Revenue increased by 32.3%, including the contribution from favourable
exchange rate movements in addition to the benefit from acquisitions, primarily
in India. Revenue growth on a pro forma basis was 19%, reflecting the growth in
India, Egypt and Australia. On an organic basis, service revenue increased by 8.5%,
primarily as a result of the 27.3% organic rise in the average customer base, although
revenue growth has slowed as a result of stronger competition coupled with maturing
market conditions.
EBITDA grew by 17.8%, with favourable exchange rate movements and the positive
impact of acquisitions contributing to the growth. On a pro forma basis including
India, EBITDA increased by 6%. The decline in the EBITDA margin resulted from
positive performances in India and Egypt being mitigated by a decline in Australia.
The impact of merger and acquisition activity and foreign exchange movements on
revenue, service revenue, EBITDA and adjusted operating profit are shown below:
Organic M&A Foreign Reported
growth activity exchange growth
% pps pps %
Revenue
Asia Pacific and Middle East 9.3 13.3 9.7 32.3
Service revenue
India – 42.5 6.0 48.5
Other 8.5 0.3 11.8 20.6
Asia Pacific and Middle East 8.5 14.2 9.8 32.5
EBITDA
India – 14.1 4.6 18.7
Other 7.3 (3.4) 13.3 17.2
Asia Pacific and Middle East 7.3 0.6 9.9 17.8
Adjusted operating profit
India – (100+) (12.6) (100+)
Other 6.6 (6.8) 14.0 13.8
Asia Pacific and Middle East 6.6 (19.7) 12.2 (0.9)