Vodafone 2009 Annual Report Download - page 8
Download and view the complete annual report
Please find page 8 of the 2009 Vodafone annual report below. You can navigate through the pages in the report by either clicking on the pages listed below, or by using the keyword search tool below to find specific information within the annual report.-
 1
1 -
 2
2 -
 3
3 -
 4
4 -
 5
5 -
 6
6 -
 7
7 -
 8
8 -
 9
9 -
 10
10 -
 11
11 -
 12
12 -
 13
13 -
 14
14 -
 15
15 -
 16
16 -
 17
17 -
 18
18 -
 19
19 -
20
-
21
-
22
-
23
-
24
-
25
-
26
-
27
-
28
-
29
-
30
-
31
-
32
-
33
-
34
-
35
-
36
-
37
-
38
-
39
-
40
-
41
-
42
-
43
-
44
-
45
-
46
-
47
-
48
-
49
-
50
-
51
-
52
-
53
-
54
-
55
-
56
-
57
-
58
-
59
-
60
-
61
-
62
-
63
-
64
-
65
-
66
-
67
-
68
-
69
-
70
-
71
-
72
-
73
-
74
-
75
-
76
-
77
-
78
-
79
-
80
-
81
-
82
-
83
-
84
-
85
-
86
-
87
-
88
-
89
-
90
-
91
-
92
-
93
-
94
-
95
-
96
-
97
-
98
-
99
-
100
-
101
-
102
-
103
-
104
-
105
-
106
-
107
-
108
-
109
-
110
-
111
-
112
-
113
-
114
-
115
-
116
-
117
-
118
-
119
-
120
-
121
-
122
-
123
-
124
-
125
-
126
-
127
-
128
-
129
-
130
-
131
-
132
-
133
-
134
-
135
-
136
-
137
-
138
-
139
-
140
-
141
-
142
-
143
-
144
-
145
-
146
-
147
-
148
 |
 |

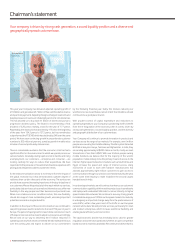
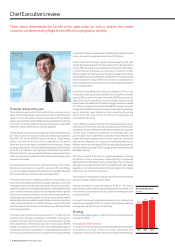
Vittorio Colao
Chief Executive
6 Vodafone Group Plc Annual Report 2009
These results demonstrate the benet of the rapid action we took to address the current
economic conditions and highlight the benets of our geographic diversity.
Chief Executive’s review
Financial review of the year
These financial results reflect the benefits of the actions we took to
adjust to the deteriorating economic environment, in particular with
respect to costs. We achieved results in line with all of the guidance
ranges we issued in November 2008 and also generated free cash flow
in line with the initial guidance range we established in May 2008,
before the extent of the downturn became apparent.
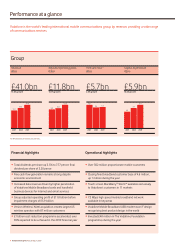
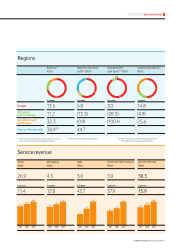
During the year, Group revenue increased by 15.6% to £41.0 billion and
by 1.3% on a pro forma basis, including India, which was acquired in
May 2007. The Group’s EBITDA margin declined by 1.8 percentage
points, in line with the first half and our expectations, one third of
which was due to the impact of acquisitions and disposals, foreign
exchange and business mix. Group adjusted operating profit increased
by 16.7% to £11.8 billion, with a growing contribution from Verizon
Wireless and foreign currency benefits offsetting weaker performance
in Europe. At year end, Vodafone had 303 million proportionate mobile
customers worldwide.
Cash generation remained robust, with free cash flow of £5.7 billion
before licence and spectrum payments, up around 3%, with foreign
currency benefits being offset by the deferral of a £0.2 billion dividend
from Verizon Wireless, which was received in April 2009.
The economic downturn is affecting Vodafone in several ways. In our
more mature European and Central European operations, voice and
messaging revenue has declined, primarily driven by lower growth in
usage and continued double digit price declines. Roaming revenue fell
due to lower business and leisure travel. Enterprise revenue growth
slowed as our business customers reduced activity and headcount.
Double digit data revenue growth continued, as we actively market
increasingly attractive network speeds, handsets and services into an
under penetrated market. In contrast to Europe, results in Africa and
India remained robust driven by continued but lower GDP growth and
increasing penetration.
In Europe, organic service revenue declined by 1.7% reflecting the
economy and a strongly competitive environment. Ongoing price
pressures and lower volume growth in our core voice products are still
being substantially offset by good growth in data. Europe EBITDA
margins, including Common Functions, which substantially support
our European operations, declined by 1.1 percentage points, driven by
an increasing contribution from lower margin fixed broadband. Mobile
contribution margins remained stable. Operating free cash flow before
licence and spectrum payments was strong at £7.6 billion.
In Africa and Central Europe, organic revenue grew by 3.9%, with
double digit revenue growth at Vodacom being offset by weakness in
Turkey. After the year end, we completed our transaction with Telkom
in South Africa and increased our ownership of Vodacom to 65%.
EBITDA margins declined by around three percentage points, driven
substantially by lower profitability in Turkey where, having appointed
new management in early 2009, we will continue to implement our
turnaround plan with a primary focus on network quality, distribution
and competitive offers.
In Asia Pacific and Middle East, revenue increased by 19% on a pro
forma basis, reflecting a strong contribution from India where revenue
grew by 33% on a pro forma basis. During the 2009 financial year we
added 24.6 million customers in India and ended the year with the
highest rate of net additions in the market. In Egypt, revenue increased
by 11.9% at constant exchange rates and EBITDA margins remained
broadly flat. The EBITDA margin in the region declined by 3.7 percentage
points, reflecting lower margins in India caused by the pricing
environment, the impact of our IT outsourcing agreement and
investment in new circles.
Verizon Wireless posted another set of strong results. Organic service
revenue growth was 10.5%, driven by increased customer penetration
and data. In January 2009, Verizon Wireless completed its acquisition
of Alltel which is expected to generate cost synergies with a net
present value of over US$9 billion and makes Verizon Wireless the
largest US mobile company with 87 million customers. During the
year, we have deepened our commercial relationship with Verizon
Wireless, which now contributes 30% of our adjusted operating profit,
with joint initiatives around LTE technology, enterprise customers and
BlackBerry devices.
The Group invested £5.9 billion in capital expenditure, including
£1.4 billion in India to drive growth. Capital intensity in Europe was
slightly above our 10% target as we took advantage of our strong cash
generation to accelerate investment in broadband and higher speed
capability on our networks in order to continue to support our strategy
and improve our customers’ experience.
The Group incurred impairment charges of £5.9 billion in the financial
year, the majority of which related to Spain.
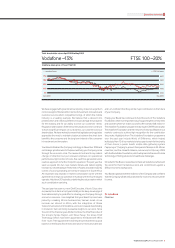
Adjusted earnings per share increased by 37.4% to 17.17 pence,
benefiting from a favourable foreign exchange environment and a one
off tax benefit. Excluding these factors, adjusted earnings per share
rose by around 3%.
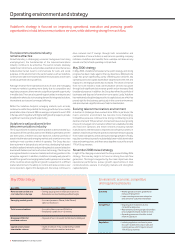
In line with the Group’s progressive dividend policy, dividends per
share have increased by 3.5% to 7.77 pence, reflecting the underlying
earnings and cash performance of the Group.
Strategy
We have made good progres s in implementing the st rateg y announced
in November 2008.
Drive operational performance
To enhance commercial value, we are developing and launching ser vices
which deliver more value in return for a wider commitment from
customers. In Germany, we have extended our SuperFlat tariff family to
Dividends per share
(pence)
2008 20092007
6.76
7.51 7.77