Vodafone 2009 Annual Report Download - page 45
Download and view the complete annual report
Please find page 45 of the 2009 Vodafone annual report below. You can navigate through the pages in the report by either clicking on the pages listed below, or by using the keyword search tool below to find specific information within the annual report.-
 1
1 -
2
-
3
-
4
-
5
-
6
-
7
-
8
-
9
-
10
-
11
-
12
-
13
-
14
-
15
-
16
-
17
-
18
-
19
-
20
-
21
-
22
-
23
-
24
-
25
-
26
-
27
-
28
-
29
-
30
-
31
-
32
-
33
-
34
-
 35
35 -
 36
36 -
 37
37 -
 38
38 -
 39
39 -
 40
40 -
 41
41 -
 42
42 -
 43
43 -
 44
44 -
 45
45 -
 46
46 -
 47
47 -
 48
48 -
 49
49 -
 50
50 -
 51
51 -
 52
52 -
 53
53 -
 54
54 -
 55
55 -
56
-
57
-
58
-
59
-
60
-
61
-
62
-
63
-
64
-
65
-
66
-
67
-
68
-
69
-
70
-
71
-
72
-
73
-
74
-
75
-
76
-
77
-
78
-
79
-
80
-
81
-
82
-
83
-
84
-
85
-
86
-
87
-
88
-
89
-
90
-
91
-
92
-
93
-
94
-
95
-
96
-
97
-
98
-
99
-
100
-
101
-
102
-
103
-
104
-
105
-
106
-
107
-
108
-
109
-
110
-
111
-
112
-
113
-
114
-
115
-
116
-
117
-
118
-
119
-
120
-
121
-
122
-
123
-
124
-
125
-
126
-
127
-
128
-
129
-
130
-
131
-
132
-
133
-
134
-
135
-
136
-
137
-
138
-
139
-
140
-
141
-
142
-
143
-
144
-
145
-
146
-
147
-
148
 |
 |

Performance
Vodafone Group Plc Annual Report 2009 43
Funding
The Group has maintained a robust liquidity position despite challenging conditions
within the credit markets, thereby enabling the Group to service shareholder returns,
debt and expansion through capital investment. This position has been achieved
through continued delivery of strong operating cash flows, effective management
of working capital, issuances on short term and long term debt markets and non-
recourse borrowing assumed in respect of the emerging market business. It has not
been necessary for the Group to draw down on its committed bank facilities during
the year.
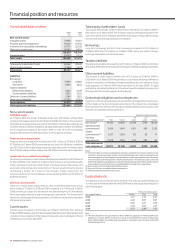
Net debt
The Group’s consolidated net debt position at 31 March was as follows:
2009 2008
£m £m
Cash and cash equivalents (as presented in the
consolidated balance sheet) 4,878 1,699
Short term borrowings:
Bonds (5,025) (1,930)
Commercial paper(1) (2,659) (1,443)
Bank loans (893) (806)
Other short term borrowings(2) (1,047) (353)
(9,624) (4,532)
Long term borrowings:
Put options over minority interest (3,606) (2,625)
Bonds, loans and other long term borrowings(3) (28,143) (20,037)
(31,749) (22,662)
Trade and other receivables(4) 2,707 892
Trade and other payables(4) (435) (544)
Net debt (34,223) (25,147)
Notes:
(1) At 31 March 2009, US$1,412 million was drawn under the US commercial paper programme and
amounts of €1,340 million, £357 million and US$108 million were drawn under the euro
commercial paper programme.
(2) At 31 March 2009, amount includes £691 million in relation to collateral support agreements.
(3) At 31 March 2009, £5,159 million related to drawn facilities, including £1,821 million for a JPY
term loan and £1,930 million for loans within the Indian corporate structure.
(4) Represents mark-to-market adjustments on derivative financial instruments which are included
as a component of trade and other receivables and trade and other payables.
At 31 March 2009, the Group had £4,878 million of cash and cash equivalents, with
the increase since 31 March 2008 being due to funding requirements in relation to
the completion of the Vodacom transaction and in anticipation of bond redemptions
occurring in May 2009. Cash and cash equivalents are held in accordance with the
Group treasury policy.
The Group holds its cash and liquid investments in accordance with the counterparty
and settlement risk limits of the Board approved treasury policy. The main forms of
liquid investments at 31 March 2009 were money market funds, commercial paper
and bank deposits.
Net debt increased to £34,223 million, from £25,147 million at 31 March 2008, as the
impact of business acquisitions and disposals, movements in the liability related to
written put options and equity dividend payments were partially offset by free cash
flow. The impact of foreign exchange rates increased net debt by £7,613 million, as
approximately 57% of net debt is denominated in euro and the euro/sterling
exchange rate increased by 16.3% during the 2009 financial year. Net debt
represented approximately 53.1% of the Group’s market capitalisation at 31 March
2009 compared with 31% at 31 March 2008. Average net debt at month end
accounting dates over the 12 month period ended 31 March 2009 was £28,462
million and ranged between £23,339 million and £34,281 million during the year.
The cash received from collateral support agreements mainly reflects the value of
the Group’s interest rate swap portfolio, which is substantially net present value
positive. See note 24 to the consolidated financial statements for further details on
these agreements.
Credit ratings
Consistent with the development of its strategy, the Group targets, on average, a
low single A long term credit rating. As of 18 May 2009, the credit ratings were
as follows:
Rating Agency Rating date Type of debt Rating Outlook
Standard & Poor’s 30 May 2006 Short term A-2 Stable
30 May 2006 Long term A- Stable
Moody’s 30 May 2006 Short term P-2 Stable
16 May 2007 Long term Baa1 Stable
Fitch Ratings 30 May 2006 Short term F2 Stable
30 May 2006 Long term A- Stable
The Group’s credit ratings enable it to have access to a wide range of debt finance,
including commercial paper, bonds and committed bank facilities. Credit ratings are
not a recommendation to purchase, hold or sell securities, in as much as ratings do
not comment on market price or suitability for a particular investor, and are subject
to revision or withdrawal at any time by the assigning rating organisation. Each rating
should be evaluated independently.
Commercial paper programmes
The Group currently has US and euro commercial paper programmes of US$15 billion
and £5 billion, respectively, which are available to be used to meet short term liquidity
requirements. At 31 March 2009, amounts external to the Group of €1,340 million
(£1,239 million), £357 million and US$108 million (£76 million) were drawn under the
euro commercial paper programme and US$1,412 million (£987 million) was drawn
down under the US commercial paper programme, with such funds being provided
by counterparties external to the Group. At 31 March 2008, there were no drawings
under the US commercial paper programme and €1,705 million (£1,357 million),
£81 million and £5 million equivalent of other currencies were drawn under the euro
commercial paper programme. The commercial paper facilities were supported by
US$9.1 billion (£6.4 billion) of committed bank facilities (see “Committed facilities”
on page 44), comprised of a US$4.1 billion revolving credit facility that matures on 28
July 2011 and a US$5 billion revolving credit facility that matures on 22 June 2012.
At 31 March 2009 and 31 March 2008, no amounts had been drawn under either
bank facility.
Bonds
The Group has a €30 billion euro medium term note programme and a US shelf
programme, which are used to meet medium to long term funding requirements. At
31 March 2009, the total amounts in issue under these programmes split by currency
were US$12.8 billion, £2 billion, €13.6 billion and £0.2 billion sterling equivalent of
other currencies.
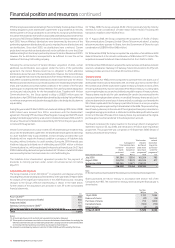
In the year to 31 March 2009, bonds with a nominal value equivalent of £4.9 billion,
at the relevant 31 March 2009 exchange rates, were issued under the US shelf and
the euro medium term note programme. The bonds issued during the year were:
Nominal Sterling
amount equivalent
Date of bond issue Maturity of bond Million Million
April 2008 April 2015 JPY3,000 21
May 2008 November 2012 €250 231
June 2008 June 2013 CZK534 18
June 2008 June 2010 €1,250 1,157
Oct/Nov 2008(1) Sept to Nov 2009 €250 232
November 2008 November 2018 £450 450
December 2008 December 2028 €186 172
December 2008 December 2013 €1,000 925
December 2008 September 2014 £100 100
January 2009 September 2014 £100 100
January 2009 January 2016 €1,250 1,157
February 2009 September 2014 £325 325
Note:
(1) Multiple bonds issued at various dates.
At 31 March 2009, the Group had bonds outstanding with a nominal value of
£23,754 million (2008: £17,143 million). On 1 April 2009, the Group issued €250 million
of 3.625% bonds, maturing in November 2012.